|
Yasser Maghsoudi
|
Department of Geomatics Engineering,
|
The University of Calgary, Canada
|
ymaghsou@ucalgary.ca
|
|
|
Michael Collins
|
Department of Geomatics Engineering,
|
The University of Calgary, Canada
|
michael.collins@ucalgary.ca
|
|
|
Donald Leckie
|
Natural Resources Canada,
|
Canadian Forest Service, Victoria, Canada
|
Don.Leckie@NRCan-RNCan.gc.ca
|
|
Abstract
Polarimetric SAR data contains a large amount of potential information that may be used to characterize forested scenes. The main objective of this research is to incorporate the spatial consistency in the classification of Polarimetric SAR data. Two Radarsat-2 images acquired in fine quad-polarized mode were chosen for this study. The images were collected in leaf-on and leaf-off seasons. The experimental results demonstrated that the neighboring information provides valuable information for the classification of Polarimetric SAR data. The classification results showed that the proposed methodimproves classification accuracy significantly over the baseline methods.
keywords: PolSAR data, forest classification, spatial context
Introduction
The extraction of information from SAR data has been an active area of research for many years and they are becoming more and more important in remote sensing applications. Despite all their advantages, the use of SAR data is subject to geometric limitations which affect the SAR data by shadows, layover, foreshortening and variation in pixel resolution over the image. In addition, because of the coherent nature of the SAR sensors, the images suffer from speckle noise [1]. Because of these reasons, it is very difficult to obtain satisfactory results from classification of single channel SAR data even if advanced classificationtechniques are used.
In order to achieve reliable results, multichannel measurements are generally necessary.The multichannel datasets can be achieved by using multi-temporal data [2, 3], multi-frequency data [4], multi-polarization data [5], fusion of different SAR sensors [6] and fusionof SAR data and optical data [7]. A combination of these approaches is also consideredin several studies [7, 8, 9, 10]. While multi-temporal, multifrequency and multi sensor approaches are widely used and fairly well documented, SAR polarimetry is a relatively newapproach which yields some advantages over the conventional methods. In this context, theremote sensing community has become increasingly interested in the use of polarimetric SARdata for the land cover mapping and forest mapping.
There are a significant number of works carried out for the classification of polarimetricSAR (PolSAR) data. Target decomposition theory laid down the basis for the classification of polarimetric SAR images and almost all classification algorithms are based on them.Particularly, the formalism worked out by Cloude [11] led to the introduction of an unsupervised classification scheme [12], further augmented and improved by subsequent contributions[13, 14, 15].
One disadvantage of most of the methods reviewed so far is that each pixel is treated to be independent of its neighbors. The local neighborhood has a significant influence on a pixel’s class membership. When a majority of pixels in a certain region are assigned to a single class, it becomes highly unlikely that a pixel in this region belongs to another class.This misassignment could likely be due to the speckle noise. Therefore, the main goal of this research is to take the spatial consistency into account. A more detailed explanation of the method can be found in section 3.
PolSAR parameters
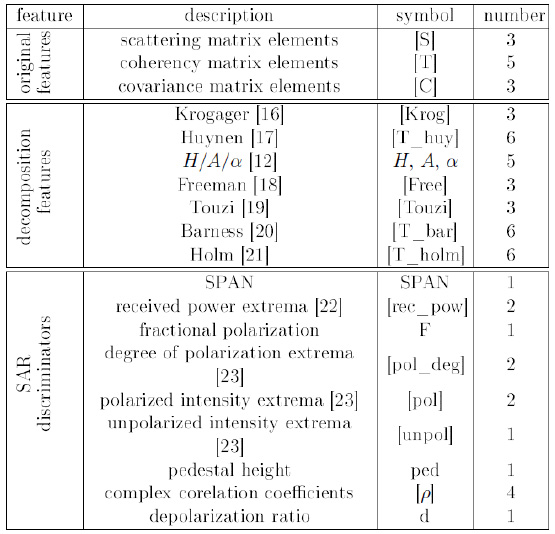
The polarimetric features can be divided into three categories: the features obtained directly from original data, the features which are derived using the well-known decomposition methods, and the SAR discriminators. These features are summarized in table 1.
Original data features include the scattering matrix, coherency matrix and co-variance matrix elements. In this study, the amplitude of the 3 scattering matrix elements, the amplitude of the 3 upper triangle elements of the covariance matrix and the amplitude of the 5 diagonal and upper triangle coherency matrix elements were used.
The main goal of target decomposition (TD) methods is to decompose or express the scattering/covariance/coherency matrices into a sum of independent matrices representing independent elements and to associate a physical mechanism with each element. This decomposition facilitates the interpretation of the scattering process. The TD methods are widely divided into coherent and incoherent approaches.
The objective of the coherent decompositions is to express the measured scattering matrix by the radar, i.e. [S], as a combination of the scattering responses of simpler objects [24],where as the incoherent decompositions aim to separate the [C] or [T] matrices as the combination of second order descriptors corresponding to simpler or canonical objects, presenting an easier physical interpretation.
The main reason for using this categorization is that the SAR parameters provided by coherent and incoherent parameters can complement each other for our goal of forest classification. Incoherent algorithms perform an averaging of the returned signals. This provides a statistically smoother description of the behaviour of the scatterers. Alternatively, the coherent methods, by avoiding the averaging at the first stage, can be used to maintain the full resolution. By combining these parameters, various forest features are emphasized. Coherent methods may focus on the more detailed characteristics of the trees such as the leaves, branches and twigs whereas the incoherent parameters may reveal the large scale components e.g. the canopy structure.
Table 1: polarimetric parameters used in this study

Finally, several quantities have been derived from PolSAR data to be used as indicators to discriminate among surface types or land covers. These include SPAN, extrema of the received power, fractional polarization, extrema of the degree of polarization, extrema ofthe total scattered intensity, pedestal height, complex correlation coefficients (coherence) and depolarization ratio.
In summary, including original data features, decomposition features and SAR parameters, we extracted 58 features from a polarimetric SAR image as can be seen in table 1.
Proposed method
One of the disadvantages of the classification methods described above is that each pixel is classified independently of its neighbors. When a majority of pixels in a certain region areassigned to a single class, it becomes highly unlikely that a pixel in this region belongs to another class. This misassignment could likely be due to the speckle noise.
In this research, we propose to incorporate the spatial consistency in the class-based feature selection (CBFS) method. The CBFS schema was already successfully tested in our previous works for the classification of hyperspectral images [25], multitemporal Radarsat-1images [26] and polarimetric SAR data [27]. The main idea of the CBFS method is thatfrom the large number of available features there are some which can discriminate each class better than the others. For a full discussion of the method the reader is referred to [25]. A brief summary follows. First, the feature selection process is applied for the first class; thus,the most appropriate features for discriminating the first class from the others are selected.Next, the most discriminative features for the second class are selected by using the same procedure for the second class. This process is repeated until all the feature subsets for all classes are selected. An SVM classifier is applied to the selected feature subsets and a simple combination rule is finally used to combine the outputs of the classification. According to this combination rule the pixel x is

in which M is the number of classifiers and N is the number of classes. In our case N = M. In this study, we propose to incorporate the spatial consistency in the combination mechanism of the class-based schema and hence the name contextual class-based feature selection(CCBFS). As can be seen in equation 1, we see that the combination is performed pixelby pixel regardless of their neighborhood. Instead, the proposed CCBFS method can beperformed for each pixel by considering the likelihoods of its neighboring pixel in different classifiers output. A weighting function w(l), centered on the pixel, was employed. Based ontheir distance, the pixels which are closer to the central pixel are given more weights. For each pixel, the weighted sum of the neighboring likelihoods can be calculated for each class in all classifiers and the pixel will be assigned to the class with the highest sum. According to this combination


Dataset and experimental results
Dataset description
Two Radarsat-2 images of the site, which were collected in the leaf-on (August 2009) and leaf-off (November 2009) seasons, were chosen for this study. All data were delivered as Single Look Complex (SLC) data. The images were acquired in the same imaging mode(FQ9) and the same orbit (ascending) as can be seen in table 2. Monitoring of environmental conditions indicated that both images had some (low) moisture on the canopy and openground vegetation at the time of acquisition. An image subset, that covers a forest area of approximately 15 x 16 km2, was selected for testing the developed classification algorithms.In this study, the combined leaf-on and leaf-off images (which include 116 features) was employed.
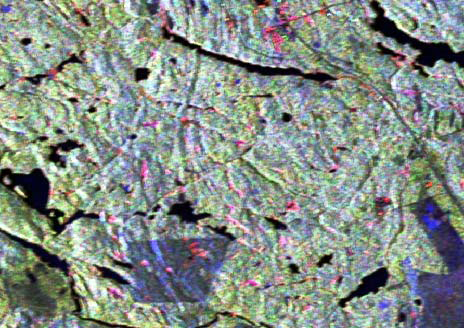
The study site selected is the Petawawa Research Forest (PRF) located near Chalk River,Ontario (45.57′ N, 77.34′ W). More information about the study area including map ofthe site and other radar results from the site can be found in [28]. The polarization color composite of the subset of the leaf-on image is displayed in figure 1. The color scheme isbased on the Pauli vector by assigning |HH –VV|, |HV| and |HH +VV| as red, green andblue. In order to evaluate the classification algorithms, a variety of different forest classeswere considered in this study. These include red oak (Or), red pine (Pr), poplar (Po), whitepine (Pw), black spruce (Sb), white spruce (Sw), ground vegetation (GV), mixed species(Hx) (mostly maple, birch and beech) and jack pine (Pj). Reference data was collected from forest inventory maps, aerial photographic interpretation, Landsat ETM+ images and fieldvisits.
Experimental results
The size of the weighting function w(l) is a critical value in the CCBFS method. It should be large enough to incorporate a fair contribution of the adjacent pixels but small enoughto minimize the transitional effects of the boundaries between adjacent classes. Therefore,window size should be selected based on the size and adjacency of existing classes in the study area. So, the question that raises here is how the window size affects the forest classification accuracy and what is the preferred window size? To answer this question, a number of window sizes ranging from 3 x 3 to 41 x 41 are used.

Figure 1: Radarsat-2 polarimetric SAR data of the leaf-on image in Pauli basis R:|HH-VV|, G:|HV| and B:|HH + VV|

The results showed that increasing the window size, the classification accuracy increases to a certain point and then it deteriorates.This can be interpreted as follows: in the beginning, the incorporated pixels are more likely from the same class type. However, when the size of the weighting window gets larger, it is highly likely that the included pixels are from the classes of different type. The deterioration is mainly due to the incorporation of non-related areas in the windowing region. Analysis indicated 13 as the best window size.
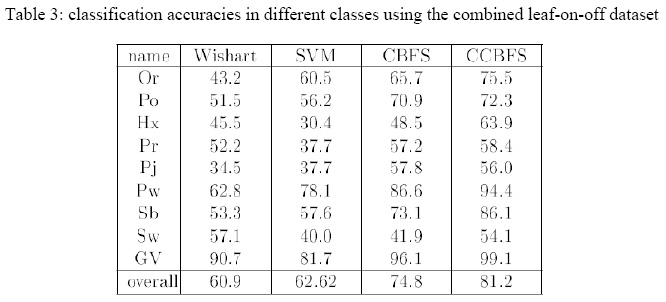
In the next experiment, in order to see how the spatial information can improve the classification accuracy, the CCBFS method is compared with the CBFS algorithm. These two methods are the same except that the latter does not incorporate the spatial information. Table 3 shows the classification accuracies of the methods. An improvement is observed in almost all the classes. The CCBFS method outperformed the CBFS method by 7%. Compared to Wishart classifier and SVM method, the improvement is 21% and 19%. Finally,a McNemar test was performed to compare the CBFS with CCBFS and the obtained p-valuewas close to zero. This indicates that the CCBFS method is significantly better than CBFS method.
Conclusions
In this paper, in order to incorporate the spatial consistency in the classification, a contextual class-based feature selection (CCBFS) method was proposed. Results obtained from CCBFS method demonstrated markedly improvement compared to simple class-based feature selection (CBFS), Wishart classifier and the support vector machine classifier (SVM). This proved that the neighboring information provides valuable information for the classification of PolSAR data.
Acknowledgment
We acknowledge the Natural Sciences and Engineering Council of Canada for financial support. The Canadian Forest Service, Natural Resource Canada in Victoria BC, with the support of the Canadian Space Agency provided valuable images and field data as well as advice on ground conditions in Petawawa. PCI Geomatics of Richmond Hill ON gave us access to their SAR Polarimetry Workstation.
References
[1] C. Oliver and S. Quegan, Understanding Synthetic Aperture Radar Images. ArtechHouse, 1998.
[2] S. Quegan, T. L. Toan, J. J. Yu, F. Ribbes, and N. Floury, “Multitemporal ERS SARanalysis applied to forest mapping,” IEEE Transaction on Geoscience and Remote Sensing, vol. 38, pp. 741-753, 2000.
[3] U. Wegmuller, A. Wiesmann, T. Strozzi, and C. L. Werner, “Forest mapping with multitemporal SAR,” in ForestSAT2002 Conference, Edinburgh, U.K, 2002.
[4] Y. Kouskoulas, F. Ulaby, and M. C. Dobson, “Classification of short vegetation usingmultifrequency SAR,” in Proc. IEEE, vol. 1, 1998, pp. 103-105.
[5] L. J. Du and J. S. Lee, “Polarimetric SAR image classification based on target decomposition theorem and complex Wishart distribution,” in International Geoscience andRemote Sensing Symposium, IGARSS, Lincoln, vol. 1, May 1996, pp. 439-441.
[6] B. Solaiman, L. Pierce, and F. T. Ulaby, “Multisensor data fusion using fuzzy concepts:Application to land-cover classification using ERS-1/JERS-1 SAR composites,” IEEETransaction on Geoscience and Remote Sensing, vol. 37, pp. 1316-1326, 1999.
[7] L. Bruzzone, D. F. Prieto, and S. B. Serpico, “A neural-statistical approach to multitemporal and multisource remote sensing image classification,” IEEE Transaction onGeoscience and Remote Sensing, vol. 37, pp. 1350-1359, 1999.
[8] B. A. M. Bouman and D. Hoekman, “Multi-temporal, multi-frequency radar measurements of agricultural crops during the agriscatt-88 campaign in the netherlands,” Inter-national Journal of Remote Sensing, vol. 14, pp. 1595-1694, 1993.
[9] S. R. Cloude, K. P. Papathanassiou, A. Riegber, and W. M. Boerner, “Multifrequencypolarimetric SAR interferometry for vegetation structure extraction,” in InternationalGeoscience and Remote Sensing Symposium, IGARSS, vol. 1, July 2000, pp. 129-131.
[10] L. Ferro-Famil, E. Pottier, and J. S. Lee, “Unsupervised classification of multifrequencyand fully polarimetric SAR images based on the H/A/Alpha Wishart classifier,” IEEETransaction on Geoscience and Remote Sensing, vol. 39, pp. 2332-2342, November 2001.
[11] S. R. Cloude,“Group theory and polarisation algebra,” Optik, vol. 75, pp. 26-36, 1986.
[12] S. Cloude and E. Pottier, “An entropy based classification scheme for land applicationsof polarimetric SAR,” IEEE Transaction on Geoscience and Remote Sensing, vol. 35,pp. 68-78, 1997.
[13] E. Pottier, “The h/a/alpha polarimetric decomposition approach applied to PolSAR dataprocessing,” in Proceedings of the PIERS-Workshop on Advances in Radar Methods, 1998.
[14] J. Lee, M. Grunes, T. Ainsworth, L. Du, D. Schuler, and S. Cloude, “Unsupervisedclassification using polarimetric decomposition and the complex Wishart classifier,” IEEETransaction on Geoscience and Remote Sensing, vol. 37, pp. 2249-2258, 1999.
[15] J. S. Lee, M. Grunes, E. Pottier, and L. Ferro-Famil, “Unsupervised terrain classificationpreserving polarimetric scattering characteristics,” IEEE Transaction on Geoscience andRemote Sensing, vol. 42, pp. 722-731, 2004.
[16] E. Krogager, J. Dall, and S. Madsen, “Properties of sphere, diplane and helix decomposition,” in Proceedings of the 3rd International Workshop on Radar Polarimetry, 1995.
[17] J. Huynen, “Phenomenological theory of radar targets,” Ph.D. dissertation, University,Delft, The Netherlands, 1970.
[18] A. Freeman and S. Durden, “A three component scattering model to describe polarimetric SAR data,” in SPIE, Radar Polarimetry, vol. 1748, 1992, pp. 213-224.
[19] R. Touzi, A. Deschamps, and A. Demers, “Phase of target scattering for wetland characterization using polarimetric c-band SAR,” IEEE Transaction on Geoscience and RemoteSensing, vol. 47, no. 9, pp. 3241-3261, 2009.
[20] R. M. Barnes, “Roll invariant decompositions for the polarization covariance matrix,”Lincoln Laboratory, MIT, Lex., MA 02173-0073, Internal Report, 1988.
[21] W. Holm and R. Barnes, “On radar polarization mixed target state decomposition techniques,” in Proceedings of the 1988 National Radar Conference, April 1988, pp. 248-254.
[22] D. Evans, T. Farr, J. van Zyl, and H. Zebker, “Radar polarimetry: analysis tools andapplications,” IEEE Transaction on Geoscience and Remote Sensing, vol. 26, pp. 774-789, 1988.
[23] R. Touzi, S. Goze, T. L. Toan, A. Lopes, and E. Mougin, “Polarimetric discriminators for SAR images,” IEEE Transaction on Geoscience and Remote Sensing, vol. 30, no. 5,pp. 973-980, September 1992.
[24] S. R. Cloude and E. Pottier, “A review of target decomposition theorems in radar polarimetry,” IEEE Transaction on Geoscience and Remote Sensing, vol. 34, pp. 498518,1996.
[25] Y. Maghsoudi, M. J. V. Zoej, and M. J. Collins, “Using a class-based feature selectionfor the classication of hyperspectral data,” International Journal of Remote Sensing,vol. 32, pp. 4311-4326, 2011.
[26] Y. Maghsoudi, M. J. Collins, and D. G. Leckie, “On the use of feature selection forclassifying multitemporal radarsat-1 images for the forest mapping,” IEEE Geoscienceand Remote sensing letters, vol. 8, pp. 904-908, 2011.
[27] ___, “Nonparametric feature selection and support vector machine for polarimetricSAR data classification,” in International Geoscience and Remote Sensing Symposium,IGARSS, Vancouver, Canada, July 2011, pp. 2857-2860.
[28] D. Leckie and K. Ranson, Forestry Applications Using Imaging Radar in Chapter 9 ofManual of Remote Sensing: Principles and Applications of Imaging Radar. AmericanSociety of Photogrammetry and Remote Sensing, Bethesda, Maryland., 1998, ch. 9, pp.435-509. |


 (5.00 out of 5)


 (5.00 out of 5)


 (5.00 out of 5)


 (5.00 out of 5)
Leave your response!