|
S. Hosseini
|
Dept. of Geomatics Engineering,
|
University College of Engineering,
|
University of Tehran,
|
Tehran, Iran -samirahoseini86@ut.ac.ir
|
|
|
A. Azizi
|
Dept. of Geomatics Engineering,
|
University College of Engineering,
|
University of Tehran,
|
Tehran, Iran -aazizi@ut.ac.ir
|
|
|
A. Bahroudi
|
Faculy of mining Engineering,
|
University College of Engineering,
|
University of Tehran,
|
Tehran, Iran -bahroudi@ut.ac.ir
|
|
|
M.A.Sharif
|
Dept. of Geomatics Engineering,
|
University College of Engineering,
|
University of Tehran,
|
Tehran, Iran -sharifi@ut.ac.ir
|
|
KEY WORDS:
Landslide Mapping, High Resolution Satellite Images, IRISP5, Rational Function Model, Conformal Transformation.
ABSTRACT
Landslide occurrence is one of the natural disasters which causes great damages annually all over the world and that is the reason, prediction and monitoring of landslides is of great concern. Landslide susceptibility determination relies largely on information which is provided by the landslide inventory maps. Therefore, precise land displacement determination can be regarded as one of the preliminary steps towards a more reliable landslide prediction. Recent improvements in satellites that are equipped with precise positioning technology on board and their large ground coverage, make high resolution images available and offer high potential for land slide monitoring and mapping. In this paper we present a strategy for three dimensional land displacement detection using HRSI stereo pairs. It starts with using IRS P5 high resolution stereo images using a manual image pointing method. Sub-pixel disparity values will be generated in image space using conformal transformation. These disparity values are multiplied by resolution values of Cartosat1 images and then terrain values are calculated. Then the calculated discrepancies can be interpreted as the detected relative land displacements. Our case study area is located in Damdol village, Ardebil Province, Iran.
INTRODUCTION
Landslide is a type of mass movement which causes numerous fatalities every year(Adiningsih and Permana ; Yang and Chen ; Suganthi and Srinivasan 2010). Producing landslide hazard map needs knowledge about previous landslide activities. Activities like field observations are time consuming and may sometimes not be cost-effective, moreover it is not possible to collect information in inaccessible area, in this approach information are achieved by point-based measurements. SAR images that are also used, measure displacement just in the direction of SAR antenna, phase ambiguity and low correlation between SAR data pairs are disadvantages of this method(Hervás, Barredo et al. 2003; Berthier, Vadon et al. 2005), High resolution satellite images can detect landslide movements with high precision(Bajracharya and Bajracharya ; Rathje and Woo). Satellite images frequently acquire from our interested regions and make it possible to study landslide movements during those periods. The methods include change-detection using manual matching and conformal transformation of images acquired before and after the movement. The application of this method is illustrated in Damdol village, Ardebil Province, Iran. This paper describes an approach using high resolution stereo satellite images (Cartosat1) for assessment of landslide hazard during 2007-2010.
STUDY AREA AND DATA USED
Landslide area locates in Damdol village, Khalkhal, Iran and covers a total area of 60 hectare. The area is located 45 kilometers south of Khalkhal and 170 kilometers south of Ardebil, north-west of Iran. Geographical longitude and latitude of area center is , degrees respectively. Part of this area is shown in figure1.
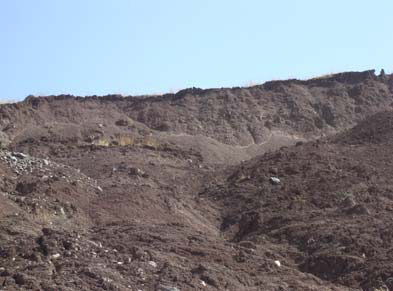
Figure1. Illustration of landslide area
Cartosat1 images are acquired on July 23, 2007, August 4, 2008, August 17, 2009 and August 30, 2010, are used in this study for identification of landslide sites. Indian Remote Sensing Satellites Cartosat1 carry pan camera, providing high resolution (2.5m) stereo imagery of the earth’s surface. These images which are related to July 23, 2007 are geo rectified and captured using along track method is illustrated in figure2.
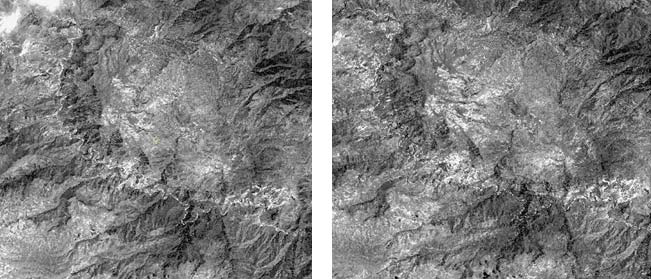
Figure2. Cartosat1 image of the study area in Damdol, Khalkhal, Iran. The images are from July 23, 2007.
METHODOLOGY
The proposed method starts by finding corresponding points using IRS P5 high resolution stereo images, a manual image matching method is applied. Displacement detection can be done using 2D and 3D analysis, 2D analysis also include 2 types which is depended on extent of area. If proportion of landslide regions to total image region are small, some fixed points that are not affected by landslide and are near the landslide movement area will participated in conformal transformation in order to achieve conformal coefficient. Displacements are achieved for the period that fixed points are selected during the same period. The conformal transformation is shown in Equation1.

Then in landslide areas corresponding points will be found and disparity values can be calculated with coefficient parameters which are achieved from previous step.
If the proportions of landslide regions to total image are large, these coefficient parameters can be solved by affine transformation. These relationships are shown in Equation2.

Because images are acquired in different view angles and different platform position before determination of movements, geometric correction is necessary. A large portion of misidentified landslide displacement may occur due to unsuitable corrections. Geometric errors are included relief and tilt displacement. Whereas these images are approximately acquire in same position, relief displacements are not significant and we can ignore them, tilt displacements that causes scale deformation, are inconsiderable in afterward images and because afterward images are used in 2D analysis for identifying disparity so there is no need for any geometric corrections.
These disparity values are multiplied by resolution values of Cartosat1 images and then terrain values are calculated. The calculated discrepancies can then be interpreted as the detected relative land displacements.
In 3D analysis, homologous points also will be matched in forward images, these points and others which are found from 2D analysis, must be intersected by rational function model to produce three dimensional terrain coordinates. At last, Terrain displacements can be detected using Helmert transformation. This transformation is shown in Equation3.

RESULT AND DISCUSSION
The proposed method uses 2D analysis with conformal transformation. Landslide displacements are illustrated in figure3, with red arrows on afterward image which is acquired on July 23, 2007. These displacements happened between July 23, 2007 and August4, 2008. As it can be seen, these disparities are significant. Maximum, minimum and mean values of these displacements in image space are shown in table1.
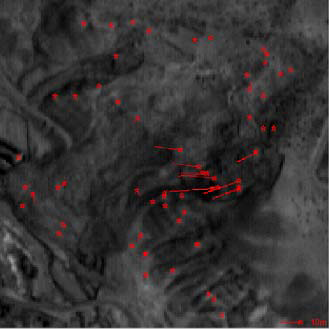
Figure3. Illustration of landslide displacements between July 23, 2007 and August4, 2008.
Table1. Maximum, minimum and mean values of displacements in image space between July 23, 2007 and August4, 2008.

According to the results, multiplying resolution value of Cartosat1 images, maximum, minimum and mean terrain displacements will be calculated 22.25m, 0.049m and 4.17m respectively between July 23,2007 and August4, 2008.
Landslide displacements are illustrated in figure4, with red arrows on afterward image which is acquired on August4, 2008. These displacements happened between August4, 2008 and August17, 2009. In comparison with displacements which are happened between July 23, 2007 and August4, 2008 these disparities are not tangible. Maximum, minimum and mean values of these displacements in image space are shown in table2.
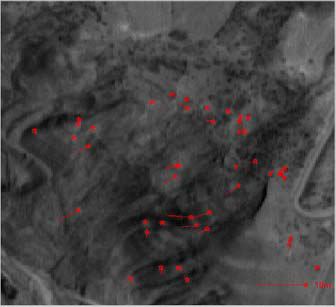
Figure4. illustration of landslide displacements between August4, 2008 and August17, 2009.
Table2. Maximum, minimum and mean values of displacements in image space between August4, 2008 and August17, 2009.

According to the results, multiplying resolution value of Cartosat1 images, maximum, minimum and mean terrain displacements will be calculated 5.07m, 0.2m and 1.53m respectively between August4, 2008 and August17, 2009.
Landslide displacements are illustrated in figure5, with red arrows on afterward image which is acquired on August17, 2009. These displacements happened between August17, 2009 and August30, 2010. These movements are tangible. Maximum, minimum and mean values of these displacements in image space are shown in table3.
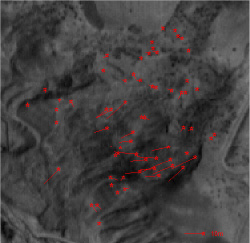
Figure5. illustration of landslide displacements between August17, 2009 and August30, 2010.
Table3. Maximum, minimum and mean values of displacements in image space between August17, 2009 and August30, 2010.

According to the results, multiplying resolution value of Cartosat1 images, maximum, minimum and mean terrain displacements will be calculated 15.69m, 0.34m and 10.42m respectively between August17, 2009 and August30, 2010.
CONCLUSION
High resolution satellite imagery can provide important information on landslide effects, this paper discussed application of IRISP5 images to determine landslide movements from July23, 2007 to August30, 2010 in Damdol, Khalkhal, Iran. Our results show significant movements during 2007-2008 and 2009- 2010, increasing of displacements can be observed in study area and people who live in this area face with a great danger.
REFERENCES
Adiningsih, e. S. And i. Permana “modelling landslide risks based on complementary use of satellite and spatial data”.
Bajracharya, b. And s. R. Bajracharya “landslide mapping of the everest region using high resolution satellite images and 3d visualization”.
Berthier, e., h. Vadon, et al. (2005). “surface motion of mountain glaciers derived from satellite optical imagery.” remote sensing of environment 95(1): 14-28.
Delacourt, c., p. Allemand, et al. (2007). “remote-sensing techniques for analysing landslide kinematics: a review.” bulletin de la societe geologique de france 178(2): 89. Hervás, j., j. I. Barredo, et al. (2003). “monitoring landslides from optical remotely sensed imagery: the case history of tessina landslide, italy.” geomorphology 54(1-2.٧٥- ٦٣ :(
Nichol, j. E., a. Shaker, et al. (2006). “application of high-resolution stereo satellite images to detailed landslide hazard assessment.” geomorphology 76(1-2): 68-75.
Rathje, e. And k. Woo “documentation of the landslide distribution from the 2 ٠٠٤niigata ken chuetsu earthquake using high resolution satellite imagery”.
Suganthi, s. And k. Srinivasan (2010). “digital elevation model generation and its application in landslide studies using cartosat-1.” international journal of geomatics and geosciences 1(1): 41-50.
Taylor, m. H., s. Leprince, et al. (2008). “detecting co-seismic displacements in glaciated regions: an example from the great november 2002 denali earthquake using spot horizontal offsets.” earth and planetary science letters 270(3-4.٢٢٠- ٢٠٩ :(
Travelletti, j., j. Malet, et al. (2009). A multi-temporal image correlation method to characterize landslide displacements with a terrestrial camera.
Yang, x. And l. Chen “satellite imagery for landslide mapping in an earthquake-struck area :a preliminary study”. |


 (5.00 out of 5)


 (5.00 out of 5)


 (5.00 out of 5)


 (5.00 out of 5)
Leave your response!