| GIS | |
The Use Of Geospatial Techniques for Identifying Seismogenic Zones in Iran
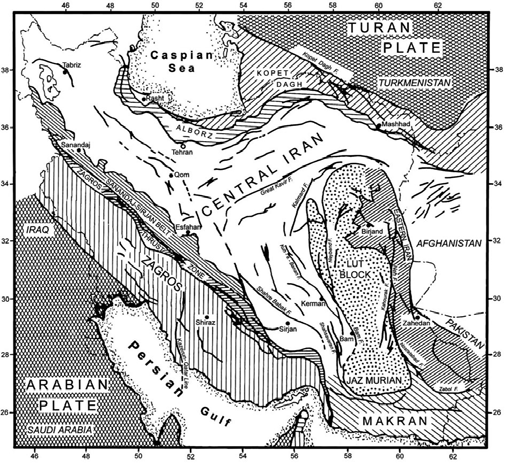
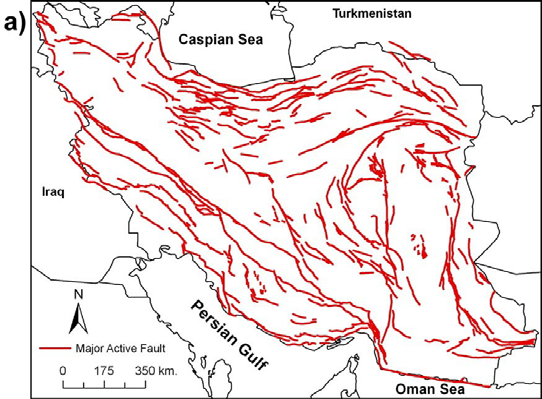
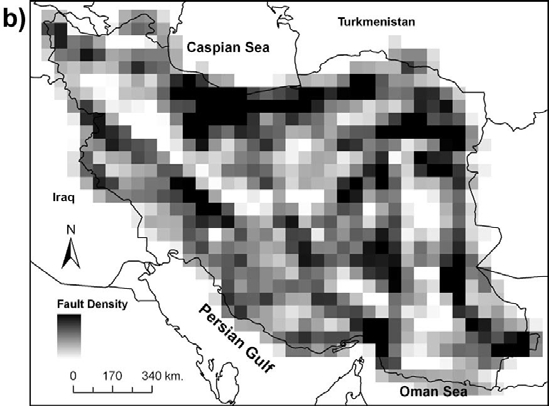
KEY WORDS:Geohazards, Iran, Seismicity, Seismogenic Zones, Spatial Analysis ABSTRACTIn this research, seismogenic zones of Iran were identified using a GIS-based spatial analysis of the seismicity and active faulting data. Density maps showing the spatial variation of seismicity and active faulting of the Iranian region were prepared. After that, by overlying and combining seismicity and active faulting data layers, the seismogenic zoning map of Iran, showing 5 seismic zones, was presented. A comparison between the seismicity and active faulting density maps indiactes that a good spatial correlation can be observed between these two parameters. It probably means that active faults are the main seismogenic sources responsible for generating earthqukes in this region. The good consistency observed between the seismogenic zoning map presented in this research and the results of the previous works indicates that the spatial analysis techniques can reliably be used for seismic hazard regionalization and identifying seismogenic hazardous zones in seismically active regions. INTRODUCTIONSeismogenic zones can be defined as areas of grouped seismicity in which the seismic activity and stress field orientation are assumed to be relatively uniform (Radulian et al., 2000). The identification and characterization of seismogenic zones, as areas capable of generating large earthquakes, is of great significance for the seismic hazard assessment of seismically active regions. The Iranian plateau is within one of the most seismically regions of the world which has experienced many large and destructive earthquakes that resulted in extensive damage and loss of life. This region occupies a part of the Alpine-Himalayan orogenic belt and can be characterized by high topography, recent volcanism, and active faulting that cause destructive earthquakes by various mechanisms. The regional seismicity pattern of Iran is characterized by frequent occurrence of moderate-magnitude earthquakes and with less frequent occurrence of destructive earthquakes with magnitude greater than 6 Richter. This study presents a GIS-based spatial analysis of seismicity as well as active faulting data of Iran in order to identify hazardous seismogenic zones of the region. For this purpose, the instrumentally seismic data (between 1900 and 2010) and active faulting data of the region were analyzed using ArcGIS Spatial Analyst tools and based on this analysis, the seismogenic zoning map of Iran was presented. SEISMICITY OF IRANDuring the past decades, many researchers studied the seismicity and seismotectonics of Iran (e.g., Mohajer-Ashjai and Nowroozi, 1978; Niazi and Basford, 1968; Shoja-Taheri and Niazi, 1981). To gain a better understanding of the overall seismicity and tectonic setting of Iran, the seismicity map of the region showing the spatial distribution of earthquake epicentres during 1900-2010 (with M>4.0) is presented in Figure 1. Additionally, Figure 2 represents the general tectonic and structural map of Iran. Figure 1. Epicenteral map of instrumentally recorded earthquakes of the Iranian region from 1900 to 2010, extracted from different catalogs (e.g., ISC, USGS, IIEES), with M>4.0. Figure 2. Generalized structural and tectonic map of Iran (adapted from Stöcklin, 1968 and Berberian, 1981). Due to the complicated tectonic nature of Iran, seismic activity is not uniform in the entire region. From Figures 1 and 2, it is clear that the most of the seismic activity of Iran occurs along the Zagros fold-thrust belt while less activity is observed in central and eastern Iran. In this regard, various structural zones can be identified. In the south and west of the region, the continental-continental collision zone of Zagros is one of the youngest and most active collision zones on Earth. The Zagros collision zone results from the north-eastward drift of the Arabian plate relative to the Eurasian/Central Iranian Micro-continent. Seismic activity in this zone is characterized by the occurrence of low to moderate magnitude earthquakes most nucleating on blind thrust faults. The Sanandaj-Sirjan belt extends parallel to the Zagros zone. Unlike the Zagros zone, the Sanandaj-Sirjan zone experiences minor seismic activity. The highly seismogenic zones of Alborz and Kopet Dagh, extending along the northern borders of Iran and Afghanistan, constitute a part of the northern limit of the Alpine-Himalayan orogenic belt. These zones make contact with the stable Turan platform (Eurasia) to the north. The oceanic-continental subduction zone of Makran, where consumption of oceanic crust of the Arabian plate occurs continuously along a north dipping subduction zone underneath the Eurasian/Central Iranian Micro-continent, covers the southern part of the region. Although this zone has experienced minor seismic activity, the existence of mud volcanoes and uplifted young beaches suggests that this zone can probably yield major earthquakes after long periods of quiescence (Berberian, 1976). Eastern Iran represents a seismically active intra-plate environment characterized by a series of predominantly north-south trending fault systems. In the last century major earthquakes have occurred in this zone. METHODOLOGYSeismicity, active faulting and the other geological and geophysical aspects are considered as geo-referenced variables and their variations over a region or area can be studied through spatial analysis assessments. Spatial analysis techniques could be reliably employed for revealing the hidden structure of geo-referenced variables, especially when the behavior of more than one variable needs to be evaluated simultaneously. In this research, the application of GIS-based spatial analysis techniques was evaluated for combining seismicity and active faulting data of Iran and presenting seismogenic zoning map for the region. For this purpose, the seismicity and active faulting density maps, provided as raster data, have been combined with equal weights to present a single map showing the degree of contrast in seismogenic activity of the region. The map resulted was used for depicting areas with high values as seismogenic zones of the region. DATA ANALYSIS AND DISCUSSIONIn this research, the seismic data of the Iranian region, covering a time period of nearly 110 years (1900-2010), extracted from different catalogs (e.g., ISC, USGS, IIEES). In order to obtain a temporarily homogeneous data catalog, seismic data were filtered and categorized into three categories: data with low accuracies and precisions (M>4.5, 1900-1955); moderately accurate and precise data (M>4.0, 1956-2005); well located precise data (M>3.0, 2006-2011). Maps showing the earthquake epicenter densities of Iran for these three time periods are shown in Figure 3. An overall view of these maps demonstrates that the seismicity of the region during the above-mentioned periods, shows a more or less stable pattern. Figure 3. Maps showing epicenter densities of earthquakes in Iran; a) with M>4.5 (1900- 1955), b) with M>4.0 (1956-2005), c) with M>3.0 (2006-2011). Additionally, in this reserach the data concerning with active faulting of the region was extracted from map presented by Hessami et al. (2003). Map showing the major active faults of Iran and the fault density map of the region are presented in Figure 4. A comparison between this active faulting density map (Figure 4a) and maps representing earthquake epicenter densities (Figures 3a,b,c) indicates that these maps show considerably good spatial correlations. It probably means that active faults are the main seismogenic sources responsible for generating earthqukes in this region. Figure 4. Maps showing major active faults of Iran (modified and adapted from Hessami et al., 2003) (a), and spatial variation of fault densities across the region (b). After preparing the density maps showing the general spatial pattern of seismicity and active faulting of the region, the seismogenic zoning map of Iran representing main seismogenic zones of the region was constructed by overlying and combining these two data layers. For this purpose, the ArcGis Spatial Analyst tools were employed. Accordingly, five separate seismogenic zones, showing higher seismic activities in relation to their adjacent areas, were identified over the entire region. Figure 5 simply presents this seismogenic zoning map for Iran. As shown in this map, five separate zones (zones I to V) were identified in this study. Zone I mainly occupies the northwestern parts of Iran and is located adjacent to Turkey. Zone II more or less covers the Alborz region and also southern coast of Caspian Sea. Zone III with a nearly NW-SE trend and as the widest zone, belongs to the Zagros folded range and zones IV and V as two separate areas occupy some parts of the east-central and northeastern Iran, respectively. Figure 5. Map showing 5 seismogenic zones (shaded areas) of Iran constructed based on spatial analysis of seismicity and active faulting data. CONCLUSIONSIn this research the spatial variation of seismicty and active faulting, as two important controlling seismic activity parameters, were assessed using spatial density estimation method by employing ArcGis sptial Analyst tools. A comparison between the seismicity and active faulting density maps provided in this research indicates that a good spatial correlation can be observed between these two parameters. It probably means that active faults are the main seismogenic sources responsible for generating earthqukes in this region. By overlying seismicity and active faulting data layers and combining these data, the seismogenic zoning map of Iran representing main seismogenic zones of the region was constructed. As a result, five separate seismogenic zones, showing higher seismic activities than their adjacent areas, were identified over the entire region. The good consistency observed between the seismogenic zoning map presented here in this research and the results of the previous works (e.g., Nowroozi, 1976; Mirzaei et al., 1999) indicates that spatial analysis techniques can be reliably used for seismic hazard regionalization and identifying seismogenic hazardous zones in seismically active regions. It is expected that in future, the analysis of more accurate and reliable data will lead to better results. REFERENCESBerberian, M., 1976. Contribution to the seismotectonics of Iran (Part II). Report No. 39, Geological Survey of Iran, Tehran, 515p. Berberian, M., 1981. Active faulting and tectonics of Iran. In: Gupta, H.K., Delany, F.M., (eds.) Zagros Hindu Kush Himalaya Geodynamic Evolution, Geodynamic Series 3, Washington DC, 33-69. Hessami, Kh., Jamali, F., and Tabassi, H., 2003. Map of major faults of Iran, scale; 1:2,500,000. International Institute of Earthquake Engineering and Seismology, Tehran, Iran. Mirzaei, N., Gao, M. and Chen, Y.T., 1999. Delineation of potential seismic sources for seismic zoning of Iran. Journal of Seismology, No. 3, 17-30. Mohajer-Ashjai, A., and Nowroozi, A.A., 1978. Observed and probability intensity zoning of Iran. Tectonophysics, 49, 21-30 Niazi, M. and Basford, J.R., 1968. Seismicity of Iranian Plateau and Hindu Kush region. Bulletin of Seismological Society of America, 58, 1843-1861. Nowroozi, A.A., 1976. Seismotectonic provinces of Iran. Bulletin of the Seismological Society of America, 66, 1249-1276. Radulian, M., Mandrescu, N., Panza, G.F., Popescu, E., & Utale, A., 2000. Characterization of seismogenic zones of Romania. Pure and Applied Geophysics, 157, 57-77. Shoja-Taheri, J., and Niazi, M., 1981. Seismicity of the Iranian Plateau and bordering regions. Bulletin of Seismological Society of America, 71, 477-489. Stöcklin, J., 1968. Structural history and tectonics of Iran: A review. American Association of Petroleum Geologists Bulletin, 52, 1229-1258 |


 (No Ratings Yet)


Leave your response!