| Mapping | |
The 3rd dimension
|
||||
|
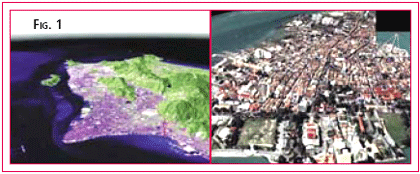
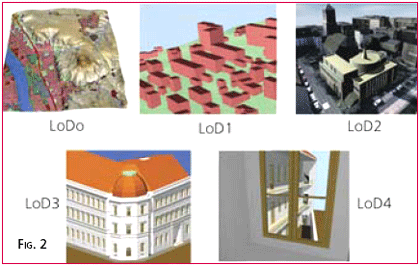
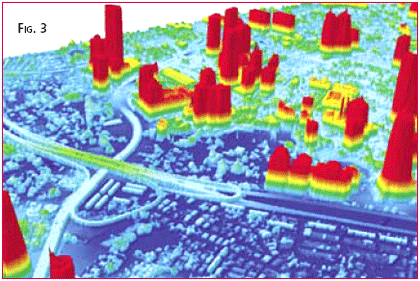
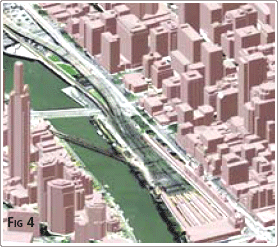
Spatial data is the fuel for 3D Applications, but all too often the fuel supplied is inappropriate. The software applied and expertise required when modelling a flood event or predicting a cityscape’s lineof-site is exactly the same using highly precise data as it is for generalised data. The difference is in how well that analysis relates to the real world … i.e. whether the analysis is correct or not. Conversely, supplying highly accurate or dense data to a generalised analysis can cost both time and money which is not reflected in the final product. Hence the word of this paper is: appropriate. Apply the most appropriate data to your application. There is nothing wrong with “approximate” or “inexpensive” 3D data, as long as it is appropriate for the level of analysis being performed. After reviewing four major components of a dataset’s composition, a number of recent case studies are offered. Finding Appropriate DataThe authors contend that there are four characteristics of a dataset which define its suitability for a 3D application, viz. resolution, accuracy, currency and format. Each is discussed briefly in turn. ResolutionResolution refers to the density of information available. In ‘the old days”, it was best summed up as the “scale” of the material under consideration. Everyone accepted that you could not do detailed design from a 1:20,000 mapsheet, or hope to see manhole covers on 1:80,000 photography. These concepts still apply to the Digital era, even though the concept of scale has been reduced to the field one enters in the PRINT window. This concept is best illustrated on two visualisations recently completed to support the Penang Outer Ring Road project. The first example is a regional dataset using Landsat imagery and SRTM surface heights (Fig 1 left). Resolution of Landsat is 30m and SRTM 90m spacing … both quite coarse but sufficient for regional analysis and often available from existing archives. The higher resolution version (Fig 1 right) involves Digital Globe imagery (at 0.6m resolution) and LiDAR surface heights (at 1m resolution). This higher resolution allows visualisation and analysis at the building-by-building level. In these cases, the resolution of the two datasets was paired well. Draping a high resolution image over low resolution surface model would have resulted in an incorrect heighting of the pixels; draping a low resolution image over a high resolution surface model would have meant the longer processing times and LiDAR capture costs were not fully returned to the project. Resolution in the context of a built environment was well described and quantified by Kolbe and Bacharach (2006), shown in Fig 2. The five “Levels of Detail (LoD)” show how the resolution (or definition) in a building can vary from a generalized outline, to intricate components. AccuracyErrors in spatial data are to be understood and enjoyed. Here is a news flash to many readers: every spatial dataset has errors. A detailed engineering survey will have errors at the millimetre level; a spatial dataset over the country will have errors at the metre level. The science of surveying is to understand the project’s “error budget” and arrive at a dataset with accuracy appropriate for its intended use. (The corollary to this is to insist that every dataset you receive comes with a metadata statement recording the accuracy and other characteristics of the dataset. A regional dataset accurate to a few metres is fine for conceptual planning, but you don’t want this data ending up in the hands of the engineers who set about detailed design work). Another news flash to readers might be that it is impossible to say how accurate every point or pixel is in your dataset. In statistical terms, data measuring is subject to random errors. Therefore it is impossible to say that “every point is accurate to 0.2m”. Because measuring and surveying are subject to the laws of statistics, surveyors rely on statistical measures to describe how accurate the dataset is. The common term to describe a dataset is “root mean square” error or “rms”. Other terminology for the same measure is “rmse”, “onesigma”, “1s” or “standard error”. What this concept means is that if you see a statement saying that “The vertical accuracy of this dataset is 0.2m rms”, it means that if you compared every point or pixel in the dataset with the truth (if somehow that were possible), then 68% of points would be within ±0.2m of the truth. The reason to use appropriately accurate data is clear to all. What is not so clear is that the work of the engineer or the effort of the visualisation specialist is generally the same regardless of the level of accuracy of the data. It is only when the flood study or the line-of-sight calculation is put back into the field and compared with reality is the quality of the underlying spatial data truly revealed. In projects involving 3D visualisation, especially in built environments, the issue of accuracy often extends to whether the buildings are defined in the application by measurement or estimation. Estimation techniques include positioning the buildings from tourist maps, estimating from imagery, or simply from memory. Building heights can be estimated by memory, reference to known heights or by counting floors. All of these estimation techniques are valid, as long as the resulting accuracy level is commensurate with the project aims. In many cases, it separates whether the project is one of “actual” or “schematics”. CurrencyCurrency refers simply to the date at which the information was captured. Decisions relating to currency typically involve assessing the relevance of off-the-shelf data, compared with the costs involved in acquiring current data specifically for your project. Acquiring current data also brings the advantage of setting resolution, accuracy and format for your project, instead of inheriting them from data acquired for other purposes. Currency can also be complicated when datasets are compiled from multiple-epochs. FormatFormat refers to the characteristics of the dataset (eg. grid, point or vector) and is often linked to the means of data capture and/or the extent of the dataset. The differences between formats are best illustrated in a built environment. The most cost-effective means of defining a cityscape is by employing the mass-points measuring technique of LiDAR (or Airborne Laser Scanning). This technique measures a dense array of accurate 3D spot elevations across the cityscape. Typical point spacing is sub-metre, with some cityscape projects in Europe now employing point spacings of a few decimetres. A LiDAR point measurement of a city defines the building height and position accurately, but the level of detail (or cartographic appeal) is relatively low. The image shown in Fig 3 is of a recent LiDAR survey of Kuala Lumpur; it illustrates the high spatial integrity but low cartographic appeal of the mass-point format. 3D-Vectors provide the most rigorous means of defining a cityscape. Typically they are obtained by stereodigitising building outlines from overlapping aerial photography. As it is a manual task, the stereooperator can pick and choose which polygons or building features needed to adequately define the building shape and appearance. The benefit of Vectors is that they provide a crisp definition of the building. Software can then extrude the 3D vectors down to the ground level to give the appearance of more lifelike structures (shown in Fig 4, from Melbourne, Australia). Because it is a manual process, costs are directly proportional to the number of buildings, and number or elements within each building, are required. SummarisingWhen deciding whether a dataset is appropriate, one needs to consider its resolution, accuracy, currency and format. Assessing the data requirements for each project will raise a series of choices. For example, a vector definition of a cityscape will look more lifelike, but it may be far less accurate than a points definition. If you have to make a choice, would you want the buildings to be lifelike or in their correct position ? You can have both, but at a significantly higher cost. Does your project warrant that investment ? On another project, you might be presented with low resolution current imagery, or high resolution archive imagery. You will have to decide whether the recent changes to the project site will detract from the information extracted from the dataset. Whatever the decision on how you assess these variables and specify your dataset, it is vital to document these characteristics so future users know the true attributes of the dataset. |
||||
Pages: 1 2


 (No Ratings Yet)


