Mycoordinates


Role of Photogrammetry and Remote Sensing in Wenchuan Earthquake

Jul 2008 | Comments Off on Role of Photogrammetry and Remote Sensing in Wenchuan Earthquake

Deren Li

 
It has been demonstrated that photogrammetry and remote sensing has played a crucial role in the aftermath of the earthquake in Wenchuan, Sichuan
   

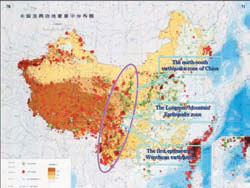
An earthquake, measured 8.0 on the Richter scale, struck Wenchuan County, Sichuan Province at 14:28 on May 12, 2008. The epicenter was at Yingxiu, a town in Wenchuan, as shown in Figure 1. As indicated in Figure 1, the middle segment of the Longmen Mountain earthquake zone encloses the epicenter, Yingxiu, with the Longmen Mountain zone
being part of the north-south earthquake zone in China. According to records, there have been 9 earthquakes larger than a grade of 8 occurring in the north-south earthquake zone from 1739, and 7 of them were after 1897, when the greatest one was at Haiyun in 1920 and at Chayu in 1950, both of them measured 8.5.

img111

Figure 1. The Wenchuan earthquake in context

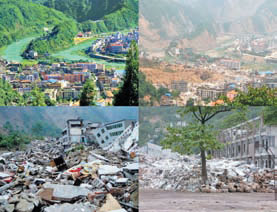
In Wenchuan earthquake, the worst hit areas include Beichuan and Qingchuan, with the earthquake intensity measured at 11, with the maximum being 12 by the Chinese seismic survey standards. By 12:00 pm on June 14, 2008, the death toll read 69,170, with 374,159 people injured, 17,428 people missing,and a population of 48,270,000 severely affected by this huge disaster. Figure 2 shows the beauty of Beichuan before the earthquake against the destruction and devastation after the earthquake.

img121

Figure 2. Pictures showing Beichuan before and after the earthquake.

Under the leadership and organization of the Chinese government and Premier Wen Jiabao, and with the support of many countries and people around the world, the Chinese people braved against the devastating earthquake, and carried out timely and active disaster relief work. Photogrammetry and remote sensing, as high-tech, has played an important role in the fight against this natural disaster. In Phase I, rescue of people buried under the rubbles was the main goal. Highresolution aerial and satellite imagery were used to locate buildings collapsed in the worst hit areas so that rescuers were dispatched. In Phase II, prevention of and preparedness for secondary disasters, i.e., landslides and mudslides, especially, those in and around the quake lakes or barrier lakes that are formed when a landslide plugs a river, top the agenda. Air-borne and space-borne optical imagery and radar data are required for identifying, assessing, and decision-making regarding locations prone to such secondary disasters. Phase III is concerned with disaster assessment and reconstruction. It is then necessary to undertake topographic mapping at 1:10,000 scale in the region with an areal extent of 120,000 km2 based on the technique of aerial photogrammetric survey without ground control points, generating information products, such as DEMs, DOQs, and DLGs. Topographic mapping in urban areas is performed at a larger scale of 1:2,000. These will better serve the people in the disaster areas so that they can outline reconstruction of their homes.

img13

Figure 3. Aerial photography flown with ADS40 (GSD: 0.3 m) showing what was left of Yingxiu Town in Wenchuan after the earthquake on May 15, 2008.

img142

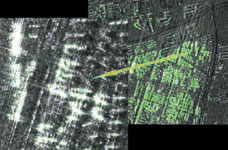
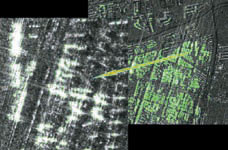
Figure 4. The image acquired by Cosmo (at a resolution of 1 m) indicating the locations (white segments) where buildings are likely collapsed after the earthquake; up to 14.8% of the areas were suspected to be results of collapsed buildings.

In the struggle against the destructive quake in Sichuan, Chinese photogrammetry and remote sensing professionals have, with supports from colleagues around the world, made various contributions as follows. For Phase I, rapid surveys and assessment of the disasters are important, as shown by Figures 3 and 4, with the former being aerial photography flown with ADS40 (GSD: 0.3 m) showing what was left of Yingxiu Town in Wenchuan after the earthquake on May 15, 2008, the latter being an image acquired by Cosmo (at a resolution of 1 m) indicating the locations (white segments) where buildings are likely collapsed after the earthquake; up to 14.8% of the areas were suspected to be results of collapsed buildings.

img141

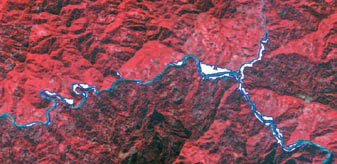
Figure 5. The change of river water ways due to the forming of quake lakes in Tangjiashan, as indicated by white regions generated by comparing SPOT5 (10 m resolution) images taken before (November 10, 2006) and after (May 16, 2008) the earthquake.

img151

Figure 6. The DEM of the quake lake in Tangjiashan, Mianyang city, Sichuan Province, one of the area worst affected by Wenchuan earthquake, which was generated based on ALS50 II air-borne LiDAR data with a sampling interval of 2 m, flight date, May 31, 2008, by the State Bureau of Surveying and Mapping, Wuhan University, and Wuda Geo Information Company (the barrier dam is shown with a inset picture)


«Previous 1 2View All| Next»

Pages: 1 2

1 Star2 Stars3 Stars4 Stars5 Stars (No Ratings Yet)
Loading...