| GNSS | |
Integrating GPS/INS/PL for Robust Positioning
|
||||||||||||||||||||||||||||||||||
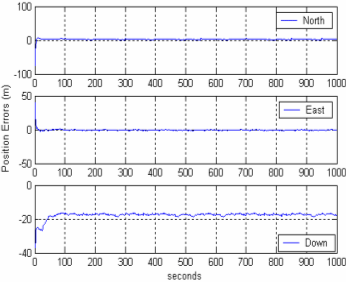
Initial ExperimentsA real-time experiment was conducted near the campus of University of New South Wales (UNSW) on the 20th and 21st December 2005 using a C-MIGITS II IMU and a Nordnav Software receiver. The IMU (position, velocity and attitude) and GPS data (I, Q) were recorded for about 15 minutes by driving the car in the suburbs of Kingsford near the UNSW. The trajectory obtained from the software receiver is shown in Figure 6. The raw inertial measurements sampled at 100Hz were processed by the INS Software to provide delta velocity and delta angle. Similarly, the correlator measurements sampled at 10Hz were processed by NordnavTM Software to provide the I, Q, position and velocity measurements. It should be noted that the four satellites used for the experiments are: PRN 4, PRN 6, PRN 10, and PRN 12. Though some low elevation satellites were tracked, as the observations get contaminated with atmospheric effects and multipath, they were ignored from the analysis. A 17-state centralised Kalman filter is used to process these data. Figure 6. Vehicle trajectory obtained from the NordnavTM software receiver The filter estimates were evaluated by comparing with an independent trajectory obtained from the software receiver. In addition, the standard deviations of the estimated navigation parameters were also analysed to check the consistency of the estimates. Some statistical assumptions in modelling the Q (process noise) and R (measurement noise) matrices of the filter are: Correlator errors were white noise with standard deviations for I σI = 0.5 and for Q σQ = 0.1, respectively; INS noise for position was σpos = 0.25m and for velocity σvel = 0.05m/s, respectively. Figures 7 & 8 illustrate the positioning and velocity performance of the ultra-tightly integrated system, obtained from a comparison between the integrated filter estimates and the software receiver navigation data. Note that the software receiver computes the navigation data based on the code-based pseudo-range measurements. The plot shows that the North errors are less than 5m, East errors less than 2m, and the vertical errors less than 20m. Occasional spikes of about 3 m in North error at epochs 550, 630, 840 and 950 can be observed due to the loss of GPS signals in one or more channels at those instances. Two important conclusions can be drawn from the results: firstly, the differences in the vertical component are relatively larger than the horizontal components. This can be attributed to the poor vertical geometry of the satellite constellation (HDOP: 3 .2, VDOP: 5.5). The mean and the standard deviations of the positioning differences are tabulated in Table 1. It should be noted that the vertical mean shows 17.65m in contrast to 3.13m and 0.54m for the horizontal components respectively. Figure 7. Position differences of ultra-tight GPS/INS estimates from the software receiver trajectory
Figure 8. Velocity differences of ultra-tight GPS/INS estimates from the software receiver trajectory
From the analyses of the results presented in Figures 7 & 8 as well as Tables 1 & 2, it can be summarised that the position and the velocity accuracies of the integrated system are stable and are within the accuracy bounds as can be expected by using a single frequency code-based receiver. |
||||||||||||||||||||||||||||||||||


 (1 votes, average: 1.00 out of 5)


