| GNSS | |
FORMOSAT-3 GPS radio occultation mission
|
||||||||||||||||||||||||||||||||||||||||
|
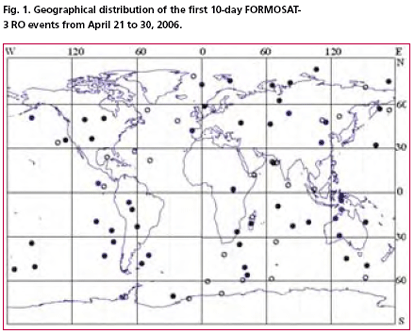
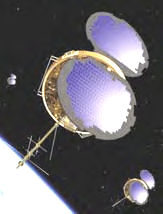
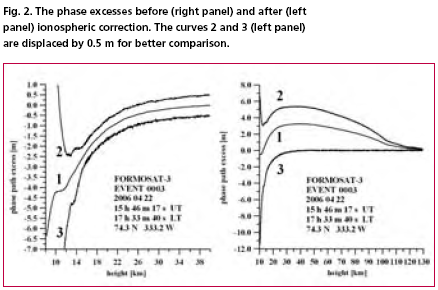
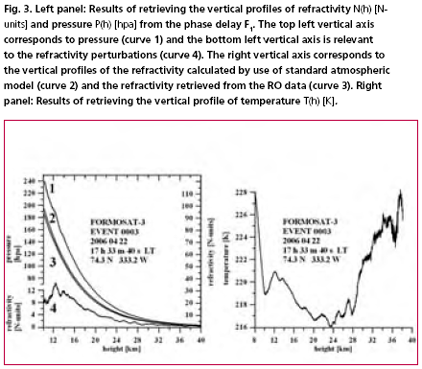
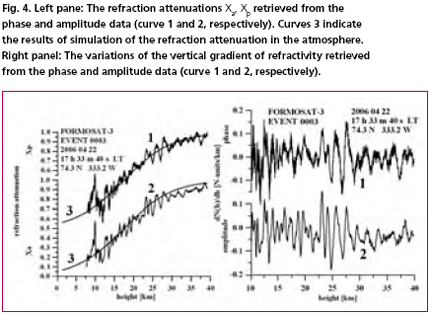
Six tiny FORMOSAT-3 satellites that were sped into space on April 15, 2006 are designed for systematic mass scale radio occultation (RO) studies of the Earth atmosphere and ionosphere at different altitudes by use of the GPS signals. Termed as the Formosa Satellite-3/ Constellation Observing System for Meteorology, Ionosphere, and Climate (FORMOSAT-3/COSMIC) mission, the new constellation’s primary science goal is to obtain in near real time the vertical profiles of temperature, pressure, refractivity, and water vapor in the neutral atmosphere, and the electron density in the ionosphere with global coverage. The measurements during five years of mission life will provide about 2,500 soundings per day, thus generating extensive information to support operational global weather prediction, climate change monitoring, ionospheric phenomena, and space weather research. The theory of RO measurements has been described previously (Gurvich and Krasilnikova, 1988; Yunck, 1988; Yakovlev, 2002; Hajj et al., 2002). During last four years, essential modernization in the RO technique has been introduced (e.g., Liou et al., 2002, 2006; Pavelyev et al., 2004 and references therein). The geographical distribution of the first 10-day FORMOSAT-3 RO mission events is given in Fig. 1 from April 21 to 30, 2006. The total number of the RO events is 86. The polar orbit of the FORMOSAT-3 satellite allows global monitoring including North and South Polar regions, and ocean areas. The records of the RO signals along the LEO trajectory during motion to radio shadow region at two GPS frequencies f1=1575.42 MHz and f2=1227.6 MHz are the radio-holograms, which contain the amplitudes A1(t) and A2(t), respectively, along the phase path excesses F1(t) and F2(t) of the radio field as functions of time. The phase path excess is measured as the difference between the real phase path in the atmosphere To exclude the transmission of noise from frequency F2, the ionospheric model is applied to the phase path excesses F1 and F2 at frequencies f1 and f2, respectively, and the atmospheric phase path excess F0, obtained after standard ionospheric correction, are shown in Fig. 2 (right panel) by curves 1, 2, and 3, respectively. The results, shown in Fig. 2 (left panel), have been obtained after subtracting from the phase excesses F1, F2, F0 the phase delay, calculated using model of standard refraction in the atmosphere (Pavelyev et al., 1996) (curves 1–3 in Fig. 2, right panel) as The model dependent ionospheric correction minimizes the noise level in the retrieved atmospheric refractivity (Fig. 2, left panel). The results of retrieved vertical profiles of refractivity N(h) [N-units], pressure P(h) [hpa], and temperature T(h) [K] from the phase delay F1 are demonstrated in Fig. 3. The data, shown in Fig. 3, left panel, are relevant to the vertical profiles of pressure P(h) (curve 1), refractivity Nm(h), obtained from the standard model of the atmosphere (curve 2), refractivity N(h), retrieved from the phase delay F1 (curve 3), and to the difference Nm(h)– N(h) (curve 4). The retrieved vertical profile of the refractivity is below the standard atmospheric refractivity profile because geographical location in the North Polar Region where the cold temperature in the lower troposphere necessitates the higher rate of diminishing of refractivity and pressure with altitude. The vertical profile of temperature T(h) obtained after the model-dependent ionospheric correction from the phase delay F1 is shown in Fig. 3, right panel. The changes of temperature T(h) are concentrated in the 216–228 K interval when the altitude is increasing from 10-40 km (Fig. 3, right panel). The influence of tropopause, where the vertical gradient of temperature changes from -5 K/km to +2 K/km is evident in the 8–11 km altitude interval. The influence of the internal wave structures with amplitudes of about 1–3 K and vertical periods 1–3 km is clearly seen in the 11–28 km height interval. The 11 K temperature increase with vertical gradient 0.9 K/ km is visible in the 28–40 km altitude interval. Therefore, the results shown in Fig. 3 indicate high accuracy of the FORMOSAT-3 RO frequency F1 data and reveal advantages of application of the RO method to The RO method is a new tool for studying the internal gravity waves (GW) on a global scale (Pavelyev et al., 2004; and Liou et al., 2002, 2006). Curves 1 and 2 in Fig. 4, left panel, demonstrate the refraction attenuations Xp and Xa evaluated from the phase acceleration and amplitude data at the first GPS frequency F1. Smooth curves 3 describe the results of modelling of the refraction attenuation. The excellent correspondence between the refraction attenuations obtained from the amplitude and phase data is clearly seen in Fig. 4, left panel (curves 1 and 2). The results of modelling of the refraction attenuation coincide well with experimental data. Thus, the phase acceleration has the same importance for the RO experiments as the well-known Doppler frequency. Note that by use of the phase data one can correct the amplitude data for systematic errors caused by the trends in the antenna gain and direction, and the receiver’s noise variations. The interesting feature of the phase acceleration consists in the diminishing of the ionospheric influence. The slow ionospheric trend, which is clearly seen in Fig. 2 (left panel, curves 1 and 2), introduces a systematic error in the phase path excesses at the frequencies F1 and F2. This error is more than contribution of the neutral component in the upper stratosphere. However, the slow ionospheric trend is not seen in the refraction attenuation (Fig. 4, left panel) because of the effect of double differentiation on time. The theoretical values of the refraction attenuation (curves 3 in Fig. 4, left panel), calculated without accounting for ionospheric influence, have significant agreement with the experimental curves 1 and 2 obtained from the amplitude and phase data. This differential effect can be used to develop a new tool for ionospheric correction. The variations of the vertical gradient of refractivity dNp(h)/dh and dNa(h)/dh [N-units/km] found from the FORMOSAT-3 RO phase and amplitude data are compared in Fig. 4, right panel (curves 1 and 2, respectively). There is a good correlation between dNp(h)/dh and dNa(h)/dh up to altitude 28 km (Fig. 4, right panel). Typical values of the vertical gradient variations are about ±0.12 – 0.18 N-units/km, and typical vertical periods are 0.8–2.5 km. Changes in the vertical gradients of the refractivity may be connected with the GW propagating through the tropopause areas and, consequently, may correspond to the changes in the horizontal wind velocity. At the 28–40 km altitudes, the amplitude and form of wave structure are quickly changed. This indicates the wave-breaking zone in the 28–30 km interval. The amplitude of wave structure diminished by 2–3 times corresponds to energy dissipation by 4–9 times. The wave-breaking effect and the instantaneous radio image of wave-breaking area are obtained by the FORMOSAT-3 mission in the first time in RO practice simultaneously in the amplitude and phase data. This observation supported the preliminary conclusion, made earlier by Liou et al., 2006, on a possibility to study the wave-breaking areas in the atmosphere by the amplitude RO method. ConclusionsThe preliminary results of the FORMOSAT-3 mission indicate its high accuracy and promising perspectives. A preliminary analysis of the FORMOSAT-3 RO data indicates new directions of application and necessitates the modernization of the RO method. A perspective direction for modernizing the RO method is connected with a new method of analysis of amplitude and phase variations in the RO signal. It is shown in this paper that the amplitude and phase variations of the RO signal contain important information on the vertical structure of the upper troposphere and lower stratosphere. This information is primarily useful for studying quasi-periodical internal waves propagating through the tropopause to stratosphere and is capable of characterizing GW in the 5- 100 km range. The phase acceleration allows recalculating the phase delay to the refraction attenuation, which is important for the future RO mission aimed to measure the absorption in the atmosphere caused by water vapor and minor gas constituents. The phase acceleration and amplitude of the RO signal are important source of information on the wave structures and give the radio image of the internal wave in the atmosphere. The application of this and other new techniques will generate extensive information on the internal wave properties in their propagation region. AcknowledgmentsWe are grateful to NSPO of Taiwan for the access of the FORMOSAT RO data. The work has been supported by National Science Council of Taiwan (NSC) grant NSC 94-2811-M-008-055, Russian Foundation for Basic Researches (RFBR) grant No. 06-02-17071, and Russian Academy of Sciences, programs OFN-16 and OFN-17. ReferencesGurvich AS, Krasil’nikova TG (1990). Soviet Journal of Remote Sensing 7, 1124–1131. Hajj, G.A., et al. (2004) J. Geophys. Res., 109, D06109, doi: 10.129/2003JD003909. Liou YA, et al., (2003) Geophys. Res. Let. 30(20), ASC 1-1 – 1-5. Liou YA, et al., (2004) GPS Solutions 8, 103–111. Liou, Y.A., et al., (2006) Journal of Geophysical Research, 111, D06104, doi:10.1029/2005JD005823, 1-14. Pavelyev A, et al., (1996) Acta Astron. 39, 721-730. Pavelyev AG, Liou YA, Wickert J (2004) Radio Science, 39(4), RS4011, 1-16, doi:10.1029/2003RS002935. Yunck TP, Lindal GF, Liu CH (1988). The role of GPS in precise earth observation. Paper presented at the IEEE Position, Location and Navigation Symposium, Orlando, FL., November 29–December 2. Yakovlev OI (2002) Space Radio Science. Ed. Taylor and Francis, London, 320 p. |
||||||||||||||||||||||||||||||||||||||||
|
||||||||||||||||||||||||||||||||||||||||
|



 (No Ratings Yet)


