| Applications | |
Combating Air Pollution in NCT of Delhi: Strategic Pathways
The Delhi Pollution Control Committee (DPCC) on 9th May 2025 invited concept notes from the IITs, professionals and NGOs on combating air pollution in Delhi. The author submitted this paper to the DPCC |
 |
|
Air pollution is the presence of contaminants or pollutant substances in the air that interfere with human health and welfare and produce harmful effects, including premature and pre-natal deaths. Urban air pollution is estimated to cost approximately 1% of GDP (source: Lancet Commission on pollution and health, 2019). The Supreme Court of India in its order dated 21st March 2024 stated that “Without a clean environment which is stable and unimpacted by the vagaries of climate change, the right to life is not fully realised. The right to health (which is a part of the right to life under Article 21) is impacted due to factors such as air pollution, shifts in vector borne diseases, rising temperatures, droughts, shortages in food supplies due to crop failure, storms, and flooding…”. As such, right to health and clean air is the right to life under the Constitution.
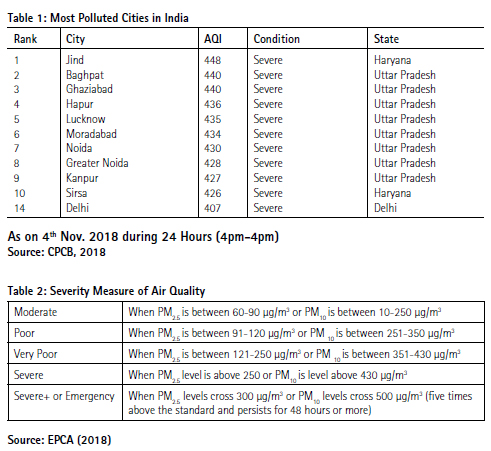
As per the Central Pollution Control Board, most of the top polluted cities are in North India, with Delhi at 14th rank, having severe levels of PM2.5 and PM10 (Table. 1).
According to Environment Pollution Control Authority (EPCA), the severity of air pollution is categorised as moderate, poor, very poor, severe, severe+ or emergency, which is based on the levels of PM2.5 and PM10 in the air. (Table 2):
Sources of Air Pollution
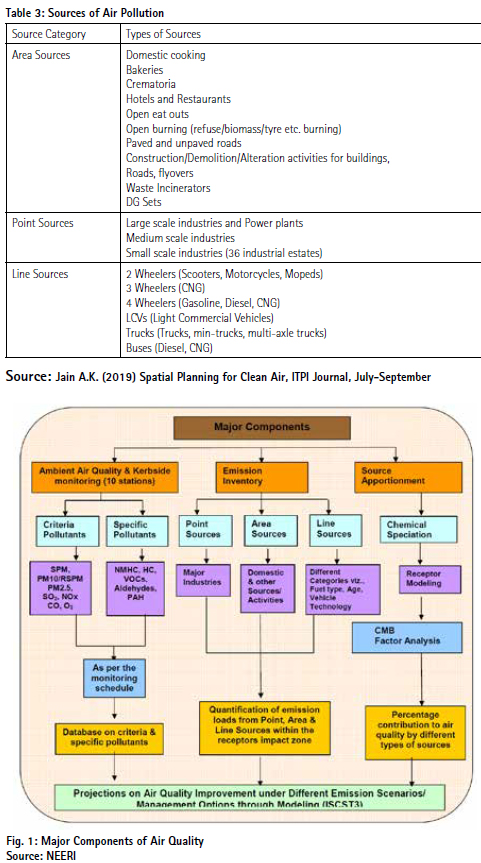
Air-pollution is a multi-headed problem which emanates from various sources (Table 3). The major components of air quality have been shown in Fig. 1. The major sources of air pollution are urban transport, dust from construction and demolition activity, the use of ‘dirty’ fuels such as diesel, use of coal for industries and electricity generation, use of wood and coal for cooking, industrial pollution, ozone depleting air-conditioners and burning of agriculture and urban wastes. While primary particles like SO2 and NO2 are directly released into the atmosphere are from sources, such as industries and vehicles and secondary particles, such as sulphates, nitrates and organic aerosols are formed from these primary particles through reaction by solar radiation, relative humidity and presence of metals.
The mean values for zinc, copper, molybdenum and chromium reported in East Delhi ranged, respectively from 119.9 to 1364.5 microgram per cubic metre, 112.8 to 1614.5 mg per cubic mt., 40.6 to 376.3 mg pcm and 68 .7 to 244.4 mg per cubic metre (CPCB, 2024). The ambient air quality criteria (aaqc) for zinc is 120 microgram per cubic metre, for copper 50 and for molybdenum 120 and for chromium 0.5 microgram per cubic metre.
A consequence of rapid motorization in India, especially in large cities like Delhi, is visible by air pollution. Environmental footprints of urban transport include the number of resources (including embedded energy) used in their production, amount of waste produced by their disposal, and continued use of fossil fuels. In Delhi 72 per cent of emissions (suspended particulate matter) are from motorized vehicles. Of these, the private vehicles, which are 90 per cent of total motorized transport, carry 31 per cent of vehicular trips are responsible for 90 per cent of emissions. Violent traffic and transport impact the health and safety of the people.
Air Quality Monitoring and Inventory
Air quality data is significant to gaining a thorough understanding of local air pollution. Recent technological advancements have made it possible to gather data, with new low-cost monitoring devices and advanced methods of collating and analysing it. This helps to gain a robust understanding of pollution levels, their causes and effect.
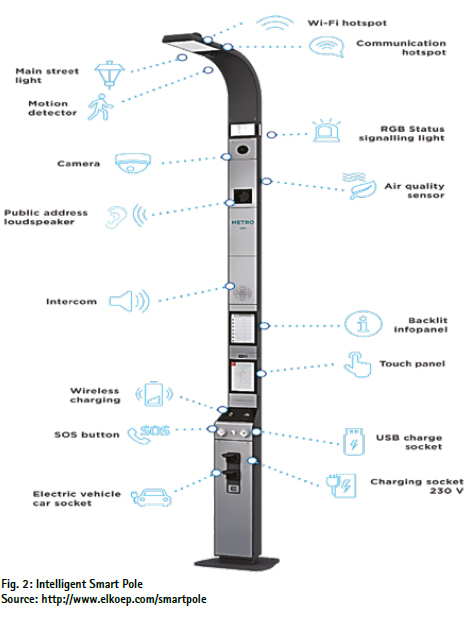
Now-a-days smart electricity poles with sensors are available to monitor pollution parameters along with light, CCTV, wi f i, etc. The New Delhi Municipal Council (NDMC) has been using them in New Delhi. Citywide air quality monitoring networks and data from these can provide consumers with a continuous feed of air quality in their area (Fig. 2)
The Google plans to map street by street air pollution that will be available to the common man. The active sensors will measure CO2 , CO, NOx, NO2 , ozone and particulate matter.
Continuous Emission Monitoring (CEM) and Air quality Data can be used to identify major components, sources, quantification and projects. It can also help the government to apply monetary incentives and penalties for polluting companies. Delhi Pollution Control Committee (DPCC) can provide tax benefits and ease other regulations on emission-efficient industries while penalizing inefficient ones. It can also use this data to introduce a cap-and trade system, instead of the existing ‘command-and-control’ regulations. The data can be used to analyse the issues, sources and project various options and actively schedule to assign the responsibilities, project management, including timelines and monitoring.
Regulating the air pollution from different stakeholders is difficult because its impact is geographically dispersed, often across the States and jurisdictional lines. For instance, around half of Delhi’s air pollution during the months of October and November is attributed to the burning of agricultural waste in neighbouring states. This means that apart from localized solutions to the air pollution, the Delhi Government must also coordinate with the governments of Punjab, Haryana, Uttar Pradesh and Uttarakhand to control this external source of pollution.
National Clean Air Programme (NCAP)
The National Clean Air Program (NCAP) and Graded Response Action Plan (GRAP) have led to the preparation of comprehensive, data based and timely measures for prevention and mitigation of air pollution.
Under the National Air Quality Monitoring Programme (NAMP) four air pollutants viz. Sulphur Dioxide (S02 ), Oxides of Nitrogen (N02/ NOx ), Suspended Particulate Matter (PM10 ) and Fine Particulate Matter (PM2.5 ) have been identified for regular monitoring at all the locations. In addition, real-time Continuous Ambient Air Quality Monitoring Stations (CAAQMS) monitor 8 pollutants viz. PM10 , PM2.5 , S02 , NOx, ammonia (NH3 ), CO, ozone (03 ) and benzene.
National Ambient Air Quality Standards (NAAQS) define the ambient air quality with reference to various pollutants notified by the Central Pollution Control Board under the Air (Prevention and Control of Pollution) Act, 1981. Major objectives of NAAQS are (i) to indicate necessary air quality levels and appropriate margins required to ensure the protection of vegetation, health and property, (ii) to provide a uniform yardstick for assessment of air quality at the national level, and (iii) to indicate the extent and need of monitoring programme. National Air Quality Index (AQI) comprises six categories, namely Good, Satisfactory, moderately polluted, Poor, Very Poor, and Severe. Each of these categories is decided based on ambient concentration values of air pollutants and their likely health impacts. For eight pollutants (PM10 , PM2.5 , N02 , S02 , CO, 03 , NH3 and Pb) National Ambient Air Quality Standards have been prescribed.
Vehicles have been identified as major source of pollution. In this regard Bharat Stage IV (BS-IV) norms has been launched for mandatory implementation since 1sl April 2017 and BS-VI since 1st April 2020. Other measures include use of cleaner/ alternative gaseous fuels, like CNG, LPG and ethanol blending in petrol in order to reduce vehicle exhaust emissions, promotion of public transport, Pollution Under Control Certificate, lane discipline, vehicle maintenance, etc. It is estimated that a 5% blending can save around 1.8 million barrels of crude oil.
The renewable ethanol content, which is a by-product of the sugar industry, is expected to result in a net reduction in the emission of carbon dioxide, carbon monoxide (CO) and hydrocarbons (HC). Ethanol itself burns cleaner and burns more completely than petrol it is blended into. In India, ethanol is mainly derived by sugarcane molasses, which is a by-product in the conversion of sugar cane juice to sugar.
Graded Response Action Plan (GRAP)
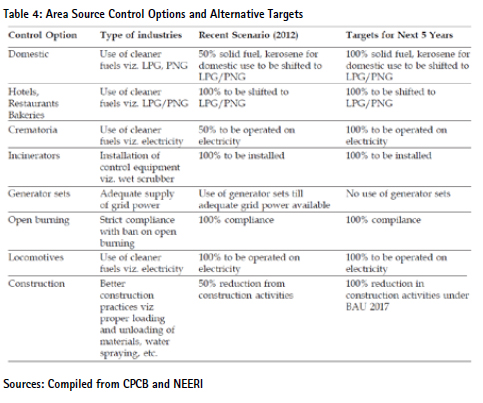
The Graded Response Action Plan for Delhi and NCR identifies the key pollution sources i.e. vehicles, road dust, biomass burning, construction, power plants and industries. The episodic pollution emanates from stubble biomass burning, solid waste burning, f irecrackers, etc. The Graded Response Action Plan includes appropriate measures for each source of pollution. The measures are graded from public health emergency level to Very Poor, Poor and Moderate AQI. The CPCB and NEERI have developed a matrix of Area Source, Control Options and Targets (Table 4).
Clean Air and Sustainable Development Goals
In order to arrest air pollution, the following agenda of sustainable development goals (2030) can be adapted:
i. Double the rate of improvement of energy efficiency and renewable energy.
ii. Prohibit thermal power stations for energy production.
iii. Halve the number of deaths per 100,000 persons caused by air pollution
iv. Halve the number of health complications per 100,000 caused by air pollution Based on the identification of major sources of air pollution and analysis of ambient air quality, various scenarios of emission control from point sources and area sources need to be worked out.
Urban Planning for Clean Air
According to the Intergovernmental Panel on Climate Change, urban areas account for more than half of global primary energy use and energy related CO2 emissions. They account for 67 to 76% of global energy use and similar amount of CO2 emissions. Infrastructure and urban form are interlinked and shape the land use, transport choice, housing and affect the sustainability and efficiency of city. This needs adopting a low carbon (thus low emission) urban form and structure.
The critical aspects of low carbon urban form for clean air comprise the following:
• Density/ FAR optimisation and linked with mixed land use
• Connectivity, walkability and transport
• Accessibility for all
• Zero polluting Industries and renewable power
• Phasing out fossil fuels
• Dust control
• Green and net zero buildings
• Landscape as sink of air pollution and urban heat
Density/FAR Optimisation and Mixed-use
Compact, high-density, mixed-use development near public transportation infrastructure provides housing, employment, entertainment and civic functions within walking distance of the transit system. Pedestrian oriented design encourages people and workers to use their cars less and ride public transit more. It aims to:
• Reduce/discourage private vehicle dependency and induce public transport use – through policy measures, design interventions and enforcement.
• Provide public transit access to the maximum number of people through densification and enhanced connectivity.
City-level integrated plans for reducing need to travel involves maximizing densities in order to facilitate maximum number of people walking or cycling or use NMT or feeder services to access public transit facility. Higher the density, lower is the per kilometre infrastructure cost. A balanced mix of jobs and housing along mass transit corridors coupled with caps on parking supply, higher housing affordability through design and technology options, improved efficiency and equity are necessary for pollution control.
It is being increasingly realized that the structural solutions, like flyovers built at enormous cost, provide only a temporary relief and fail to keep pace with the growth of traffic. For a synergy between land use and public transport system, it is necessary to restructure the city by Transit Oriented Development, higher density, FAR and mixed land use for a compact and smart growth.
Connectivity, Walkability and Transport: Prime Minister Narendra Modi while inaugurating the Global Mobility Summit in September 2018, encapsulated 7 Cs of mobility- common, connected, convenient, congestion-free, charged, clean and cutting-edge. He underlined the need to use clean energy for transport as a powerful weapon against climate change. This means a pollution-free clean drive leading to clean air and better living standards. He championed the idea of clean kilometres which could be achieved through bio-fuel, electric or solar charging and electric vehicles (PIB 2018).
Studies show that road transportation needs 4 to 5 times the energy that is needed by a train. The energy used by a car to carry a passenger over one kilometre is 3 to 4 times that of a bus. Greenhouse gas emission per passenger of public transport (bus, rail and trams) is about one-twelfth that of a car. Although Non-Motorised Transport (NMT) including walking is ideal from the point of view of emissions, in terms of kilometres travelled, these cover only 1 to 2 per cent of the total kilometres travelled, even if the proportion of trips are as high as 40%. It implies that rail based public transport, bus, cycle and walking provide a greener transportation by reduction in use of fossil fuels and air pollution. A compact and smart city with mixed land use, cleaner, fast and low energy public transport provides sustainable mobility. In terms of capacity, costs and emissions, walking is most competitive, economical, and environmentally sustainable mode of mobility.
The installation of engine optimization and exhaust gas recirculation technologies and promoting rail and waterways for public transport and freight can reduce black carbon emissions by 90%. Some other critical areas to reduce emission from transport include:
• Adopt the concept of 15-minute city, as Paris has done.
• Development and spread of public transport with single ticket facility for various modes
• To increase the use of electric cars, e-rickshaws, and e-buses
• Building express cycle tracks along major roads, parks, drains, canals and railway/metro corridors
• Walk to work concept for integrated development of work centres/local areas/zones
• Initiating a consumer campaign for car pooling, bus pooling and ridesharing
• Building support for tighter controls on vehicular emissions and stricter compliance with PUC norms.
• Providing N-99 pollution masks to traffic policemen, rag pickers, street vendors, sanitary workers, construction workers, students, etc.
Accessibility for All
Informal and intermediate modes of transport, which include 3 wheelers, vans, pickups, rickshaws, manual thelas and rehri, etc. cater to about 30 to 60% of passengers and goods movement in the cities like Delhi. As compared to small truck, the autos and rickshaws are substantially cheaper, which by multiple trips deliver as much as a 5-ton truck in a day. Courier services, perishables, such as milk, vegetables, fruits, groceries and other short-haul deliveries are increasingly being made by auto-rickshaw, van or tricycle, These reach in the narrow lanes and congested areas where public authorities do not allow trucks/public carriers during day time and also during frequent VVIP visits, processions, ceremonies, etc.
The urban form plays an important role in the safe urban mobility by accommodating all modes to travel, including walking, wheelchair, cycling, public transit and people by a safe, efficient and attractive road network, with generous footpaths and trees.
Safe and accessible cities are compact, walkable and sustainable, which provide comfortable, safe, affordable, reliable and non-polluting public travel modes. Most of the local facilities are reachable by a convenient 5-minute (400 to 500 meter) walking, with dedicated paths for walking and cycling. Neighbourhood facilities, shops, schools, parks, clubs and city centres are located along the pedestrian, cycle and public transport corridors.
The strategy for non-polluting and safe mobility covers the following:
• Reduce need to travel by Transit Oriented Development and Travel Demand Management, last mile connectivity and 15 minutes city concept
• Improvement of public transport, sidewalks, cycle tracks, NMVs underpasses and overpasses
• Safety oriented planning and engineering specifications, norms and practice
• Upgrading of traffic control – multi-functional and sophisticated signal control and ITS
• Drivers’ license regime
• Work Zone Safety
• Intelligent Transport Systems (ITS), car, bus, truck pooling
It is necessary to provide barrier free, wide and safer pedestrian corridors at grade which cater to wheelchair users. Public transport has to be disabled and wheelchair friendly with tactile flooring, low floor buses with footboard at level with the platform and proper lighting for the safety and security of pedestrians. A dedicated bicycle lane has to be built along every road. The signage, maps, variable message signs, pedestrian crossings, integrated fare collection systems, protection systems and communication are important elements of safe mobility.
The traffic calming involves reducing speeds, noise and volumes by various measures such as no horn zoning, traffic circles at intersections, raised crosswalks, and partial street closures to discourage short-cut traffic through residential neighbourhoods. Traffic calming is necessary in residential zones, and also in the areas fronting university, college, schools, hospitals, etc. Traffic calming/ noise control measures involve notifying No Horn Zones, constitution of area wise noise control circles, preparation of Noise Monitoring and Control Plan (NMCP), hybrid electric vehicles, speed breaker/hump, landscape and noise buffers and rubberised road surface.
Zero Polluting Industries and Renewable Power
Industries and power have a crucial role in combating air pollution. These industries need to shrink their environmental footprint by following measures:
• Strengthening of enforcement and emissions monitoring
• Scaling up of Emissions Trading Schemes.
• The development and installation of emissions free technologies, especially in the power and brick-making industries.
• Installing continuous emissions monitoring technology (CEMS) at manufacturing locations and placing more accountability on industrial polluters
• Introduction of gaseous fuels and enforcement of stringent SO2 /NOx /PM2.5 standards for industries using solid fuels.
• Elimination of DG set usage by provision of 24×7 electricity and by innovative tail pipe control technologies.
• Use of agricultural stubble/residue in power plants and industries to replace high ash coal and open burning in fields.
Innovations at local level are important. Chakr Innovations Pvt. Ltd. proposed a technology that coupled with exhaust pipe of diesel engines absorbs PM emissions and converts the captured particulate matter into black ink and paints. In this project, the goal was to test the effectiveness of Chakr’s device in reducing PM emissions and assess if this technology is a cost-effective way of reducing diesel genset pollution.
Another project, Charvesting, deploys charvesters that recycle rice straws into biochar with clean emissions using the biochar reactors. It helps farmers to comply with existing air pollution laws at minimal cost and effort, increase soil productivity and restore depleted land.
Phasing Out Fossil Fuels
Air pollution is caused by burning of fossil fuels, especially for cooking, wastes, etc. This can be mitigated by following measures:
• Strengthening and Incentivising Electric Vehicles
• Boosting of PNG Supply Network and clean-cooking stoves that use PNG/ LPG or solar energy.
• The implementation of gasification technologies to help convert waste into biomass pellets or electricity.
• Green hydrogen as a substitute for fossil fuels.
Dust Control
Dust is a major contributor to urban air pollution. It is necessary to adopt wall to wall paving of roads, green cover, trees and shrubs and the vacuum sweeping of roads.Dust particles can be controlled by screens, filters, flagging machines, vacuum cleaning, humidification, sprinkling of water and artificial rain.
Green and Net-Zero Buildings
The polluting agents found indoors are chemicals such as cleaning products, volatile organic compounds, dust, infectious agents, fragrances, cooking fumes, smoke, etc. Mold spores and various other particulate matters and toxic gases are the biggest pollutant found in the air. A humidity level of 65% or more, along with a temperature ranging between 100 and 320 C make a suitable environment for the mould spores to grow indoors. Mold growth can be prevented by increasing natural ventilation, covering cold surfaces like water pipes with insulation, and increasing the air temperature and keeping all hard surfaces clean by washing or wiping with detergent or other disinfectants.
Proliferation of low-carbon, net zero and green building technologies that produce as much energy as a building consumes, can help in controlling the air pollution, wider use of green rating, such as GRIHA, can help reducing the building’s energy consumption and emissions. Passive design of buildings can reduce the need of air conditioning. For a comprehensive approach, it is necessary to prepare energy efficiency and low carbon neighbourhood plans.
Green Roof Mahila Housing SEWA Trust, in collaboration with the Energy Research Institute (TERI) and Energy Policy Institute at the University of Chicago, (India unit) has deployed cool roofing solution in a Delhi slum which attempts to lower indoor temperatures and energy consumption for cooling.
Landscape as Sink of Air Pollution and Urban Heat
Bio-morphic and green ecosystems that mandates coexistence of nature, greenery and water bodies can make a difference between life and death in the present air crisis scenario. The plants remove toxic pollutants from environment by the process of phytovolatilization (pollutant is released in volatile or gaseous form), phytoextraction (pollutant is accumulated in harvestable parts tissue like leaf surface), phytodegradation (pollutant is broken down into simpler molecular form), Phyto stimulation (organic pollutants from soil are broken down ensuring oxygen to the rooms) and Phyto-stabilization (pollutant is immobilized in soil).
It is often said that there is no more space for plantation and forestry in Delhi. However, large greens can be created along the river Yamuna (1600 Ha), along the drains and canals, along Ring Railway Corridor, Metro and Rail Networks, defunct thermal power stations, adjacent to monuments in Mehrauli, Tughlakabad, IARI Pusa, Roshnara Park, Quadsia Park, etc. It is also time to design and develop vertical greens integral to multi-storied buildings.
It is well known that with climate change, Delhi is heating up, leading to increased use of energy for air conditioning/ cooling. The GNCTD has recently prepared a Heat Mitigation Plan, which needs to be implemented urgently. An important aspect of heat mitigation is improving air quality and pollution. As such, it is necessary to sustain existing trees and increase number of healthy trees, which reduce pollution levels. Evergreen trees with smaller, rough and variegated leaves are more efficient in trapping air pollutants than longer and smooth leaves.
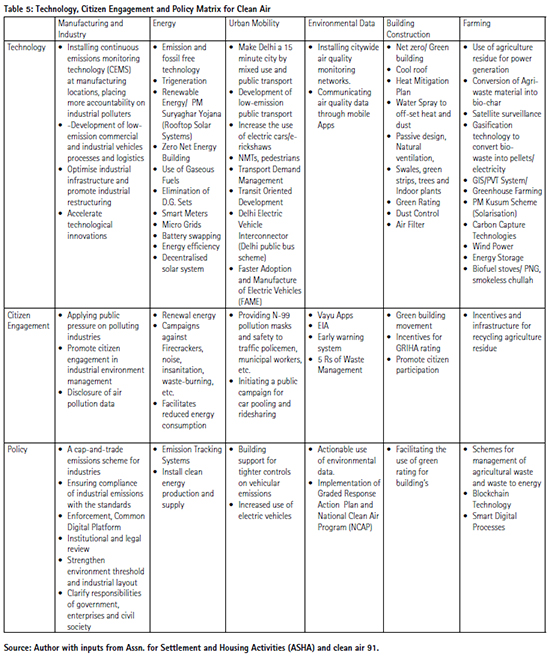
Strategic Pathways Towards Clean Air
Strategic pathways involve a synergy of Technology, Citizen Engagement and Policy Matrix that addresses critical factors of air quality (industry, energy, urban mobility, environmental data, building and construction and farming). Table 5 provides a strategic pathway for clean air in Delhi. It starts with digital, real-time documentation of various sources of air pollution for the preparation of air pollution control plans. It underlines low carbon, low-emission alternatives such as, zero net energy buildings, blockchain technology and smart utilities involve Big Data Analytics, Supervising Control Data Acquisition Systems (SCADA), ERP solutions, GIS Integrated Control and Command Centres and Satellite Surveillance. The strategic pathways incorporate timelines, responsible department/ agency and monitoring mechanism. The public participation and behaviour change are its pillars. It involves close coordination among various departments, States, local and parastatal agencies.
In this regard, The PRAGATI (Pro-Active Governance and Timely Implementation) Platform being adopted for major infrastructure projects, and Whole of Government Platform being adopted for PM Gati Shakti Master Plan can enable easier collaboration for seamless implementation and citizen engagement.
References
Central Pollution Control Board (2018-2025) Reports on Air Pollution in India, New Delhi.
Delhi Pollution Control Committee (2018–2025) Real Time Ambient Air Quality Data of Delhi, India: http://www.dpccairdata.com/ dpccairdata/display/index.php.
Environmental Pollution Control Authority (EPCA) (2018) Report Card on Delhi’s Air Pollution, New Delhi
IPCC (2021) Climate Change Working Group, Impacts Adaptation and Vulnerability, IPCC, Cambridge University Press, UK and New York.
IPCC (2014) Climate Change Working Group, 6th Assessment Report, Cambridge University Press, UK and New York
Jain A.K. (2021) Environment, Urbanisation and Development, Discovery Publishing House, New Delhi
Jain A.K. (2019) Spatial Planning for Clean Air, ITPI Journal, New Delhi
Lancet Commission on Pollution and Health (2019) The Lancet Planetary Health, Vol. 3
World Health Organisation, (2018) WHO Global Ambient Air Quality Database, Geneva.


 (2 votes, average: 4.00 out of 5)


Leave your response!