| Mycoordinates | |

Mangrove habitat dynamics
|
|||||||||||||||
|
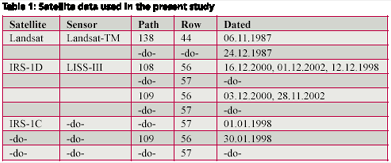
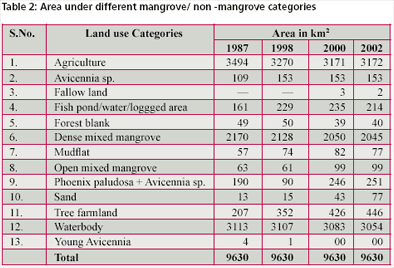
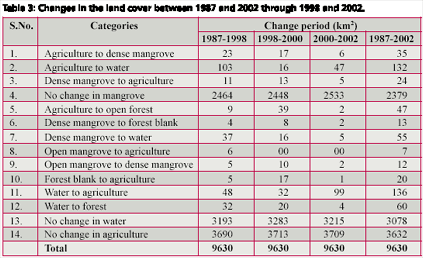
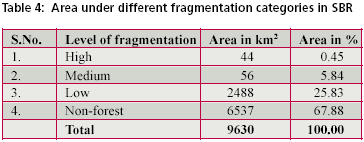
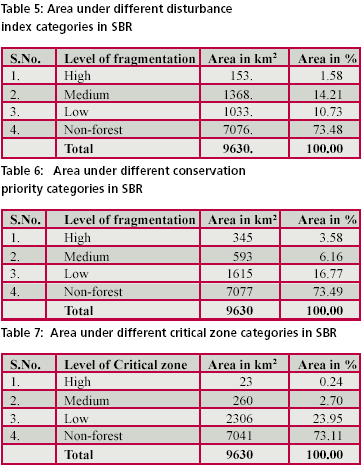
Baseline information on mangrove resources is still lacking and improper utilization has lead to their threatened status. Present study gives the type and extent of vegetation cover available and the kind of changes it has experienced. The trends of changes have been utilized for predicting the future extent and distribution. The above and distribution. The above information was then used for conservation prioritization. Study areaSunderban is located in eastern India in the state of West Bengal along sea coast. The total geographical area of the Indian part of Sunderban is 9630 km2 between the (21° 31”N and 22° 30”N and 88° 10” E and 89° 51” E), in north and south 24-Pargana districts. The limit of the Sunderban has been demarcated by the Dampier and hodges Line in 1831. Six principal estuarine rivers viz; Bartala, Saptamukhi, Thakuran, Malta, Gosaba and Herobhanga drain via Sunderban into the Bay of Bengal in the southern extremities. The area falls under the inter-tidal zone and has tropical humid climate. Sunderban has also been declared as Biosphere reserve (BR) under Man and Biosphere (MAB) of UNESCO and as World Heritage Site (1987). About 40 percent of the reserved forest area of SBR under protected area, which includes Sunderban Tiger Reserve (2585 km2), Sunderban National Park (1330 km2), Sajnakhali Wildlife Sanctuary (362 km2), Lothian wildlife Sanctuary (38 km2) and Haliday Wildlife Sanctuary (6 km2). Data and MethodsLandsat-TM and IRS-1D/1C, LISS-III digital data were used for the present study. The details of the data are given in Table 1. Survey of India (SOI) topographic maps of the study area on the 1:50,000 scale were used for geo-referencing. Village locations, roads, ferry network and drainage information was also taken from SOI maps. A ?eld survey from Canning to Baghmara was carried out for four days to recognize and relate vegetation types to respective tonal variations on Satellite image. Various observations were noted in vegetation types and species composition. Major vegetation types together with locality details were recorded. All possible estuaries and creeks were visited using a jetty. Geometric and radiometric corrections were applied to the satellite data. The dark pixel subtraction technique (Lillesand and Kiefer; 1987) was used for radiometric correction. Different band combinations were used to extract more information from imagery. In general, the Landsat-TM (5,6,1) and LISSIII (3,4,1) were found to be good for delineation of Phoenix paludosa and Avicennia sp. dominated mangroves. non-forest patches and fragmentation was carried out using Bio_CAP program. The vegetation cover map was reclassi?ed into two categories namely, forest and non-forest. The fragmentation image was recoded to three levels of fragmentation excluding non-forest and snow/cloud classes and the area was calculated. A raster-based analysis was carried out on the forest and non-forest map. The fragmentation weightage was used to ?nd out the maximum disturbed or the possibly disturbed areas. The weights were assigned to various levels of landscape indices for deriving conservation index viz; (change map 4, Soil 0.25, drainage density 1, disturbance index 2, land use/land cover 0.5, geomorphology 0.25). The high values require more attention for conservation strategies.The critical area for conservation in SBR was obtained by change analysis technique. The three period (1987-1998, 1998-2000, 2000- 2002) time series analysis was carried out to ?nd the dynamism of the pixel on temporal domain. The dataset was rescaled on the basis of dynamism. The highly dynamic pixel was named as critical areas. The areas are attributed to maximum changes in spatial extent due to both natural and anthropogenic agents. The mangrove dominated areas were strati?ed in three levels viz; high medium, medium and low. The ground knowledge and socio-economic drivers were used to validate the results. Results and DiscussionFourteen land use/land cover classes viz., agriculture, Avicennia forest, fallow land, ?sh pond/water-logged area, forest blank, dense mixed mangrove, mud ?at, open mixed mangrove, Phoenix paludosa forest, sand, tree farmland, water body, young Avicennia were mapped. The area under various categories is shown in Table 2. Maximum area is occupied by agriculture (32.93% of the total study area), followed by waterbodies (31.71%) and Pheoenix paludosa, Avicennia sp. (2.60%). Open mixed mangrove occupies 0.65% whereas Avicennia sp. occupies 1.58%. Tree farm land occupies 4.63% and sand occupies 0.79%. From the Table 2 it is clear that maximum area under agriculture was 3270 km2 during the period of 1998 and ?sh pond/water logged area occupies 235 km2 during the year 2000 and it is maximum in-between 1987-2002. Dense mangrove is estimated maximum during 2170 km2 (1987) and goes on decreasing in the subsequent years 2128 km2 (1998), 2050 km2 (2000) and 2045 km2 (2002). Phoenix paludosa and its associates spp has shown increasing trends 190 km2 (1987) to 251 (2002), it is also indicating that lot of opening is coming is up because Phoenix paludosa is up because Phoenix paludosa is light demanding. In SBR, lot of accretion is taking place and this is validated by the area of sand which shows a constant increase from 13 km2 (1987) to 77 km2 (2002). Change detection was carried in the image processing software in the GIS analysis through matrix for the period of 1987-1998, 1998-2000, 2000-2002 and 1987- 2002. Table 3 shows the results. Maximum area converted from agriculture to mangrove 82 km2 from 1987 to 2002, dense mangrove changed to forest blank 13 km2 in between 1987- 2002 and dense mangrove to water 55 km2 from 1987-2002.The fragmentation image obtained was categorised into three levels of fragmentation: low, medium and high. The area statistics shows 25.83 per cent area to be intact. Low, medium and high fragmentation areas together constituted 6.29 per cent of the area. The area in the western side of SBR (Ajmalmari and Dulbhashani) shows high level of fragmentation. These areas are close to settlements, roads and ferry points. Table 4 shows the fragmentation map of SBR. The SBR was found to be under low level of fragmentation. The area showing medium level of fragmentation all over Sunderban Biosphere Reserve is mainly on the fringes of creeks and channels. Disturbance index image obtained was reclassi?ed in to three levels of disturbance: low, medium and high. 10.73 per cent of the area falls under low level of disturbance. 14.21 per cent had medium and 1.58 per cent had high level of disturbance. Low disturbance areas were characterized by low level of porosity, fragmentation, patchiness, interspersion and high level of juxtaposition. The undisturbed and homogenous nature of mangrove forests was observed in porosity image. The image showed high levels of disturbance in western part of SBR (Saptamukhi, Thakuran and Ajmalmari). These areas are close to human habitation, roads and ferry points. Inaccessibility, risk to life from tiger and restrictions imposed by forest department are reasons for low disturbance in SBR. Conservation priority of the area was determined based on the information on forest cover, change, soil, drainage density, disturbance regime and geomorphology. The result shows that Lothian, Dia, Jameson, Prentice, Thakuran, Burge, Ajmalmari, central area of Herobhanga, eastern part of Sajanakhali WLS, Jhilla, northern side of Baghmara, central region of Gosaba and eastern side of Mayadwip need immediate attention. 3.58 per cent of the area falls under high priority zone. Medium and low together contribute 23.93 per cent of the total area. Middle level of conservation priority area is spread all over the Tiger Reserve and that too con? ned to creeks and channels. Most of the low conservation Priority areas are in the Tiger Reserve area except Dulbhasani and Chulkati area which comes under south 24 pargana division. The critical area map shows that the area near habitation and the loss in mangrove forest due to natural ebb erosion are to be considered for conservation on priority basis. These areas come under Jambudwip, Sagar Island, Lothian Island and Ajmalmari. In the year 2020, the SBR will have 873 km2 area under dense forest with more than 70 per cent probability, and 1311 km2 dense forest with more than 50 per cent and less than 70 per cent probability. In the year 2050, it will have104 km2 dense forest with more than 70 per cent probability and 2097 km2 dense forest with more than 50 per cent and less than 70 per cent probability. Conclusions * Areas near habitation and facing creeks and channels are highly disturbed. AcknowledgementsThe author is thankful to Dr S P S Kushwaha, Dr P K Joshi and Dr Alok Saxena for guiding me in my MTech programme. My sincere thanks goes to Dr Devendra Pandey, Director, Forest Survey of India, for his encouragement and Shri A K Raha, Director, Sunderban Biosphere Reserve for ? eld support and suggestions. |
|||||||||||||||
|
|||||||||||||||
|




 (2 votes, average: 4.50 out of 5)