|
Ali Javidaneh
|
Graduate students of GIS
|
Department of Surveying and Geomatics Engineering,
|
College of Engineering,University of Tehran
|
Tehran, Iran
|
ajavidaneh@ut.ac.ir
|
|
|
Shima Rahmatizadeh
|
Graduate students of GIS
|
Department of Surveying and Geomatics Engineering,
|
College of Engineering, University of Tehran
|
Tehran, Iran
|
sh_rahmat@ yahoo.com
|
|
|
Mohammad A. Rajabi
|
Associate professor of GIS
|
Department of Surveying and Geomatics Engineering,
|
College of Engineering, University of Tehran
|
Tehran, Iran
|
marajabi@ut.ac.ir
|
|
KEYWORDS
Urban Growth, Cellular Automata, neighborhood size
ABSTRACT
Urban growth faces a great increase during recent decades. Many studies have been done to study and model this phenomenon. One of the suitable approaches to do so is cellular automata. In cellular automata, each cell state is dependent on its neighbor cells. This is what happens in urbanization. Many researchers have studied use of CA for urban growth modeling. In this paper, authors tried to study the effect of neighbor size in prediction process of urban growth. The results show the smaller neighbor size, the more precise prediction.
Introduction
In the recent decade, urbanization of human geographical processes has a great increase [ HYPERLINK \l “KCL98” 1 ]. On the other hand in the recent decades, widespread researches have been done by researches such as John von Neumann, Stephen Wolfram, and John Conwayon the cellular automata. The most common definition is presenting CA as a dynamical discrete system in space and time that operates on a uniform grid-based space through implementing local rules 2]}. CA is an iterative computational process. The future cell state is determined based on a function of neighbor cells states. CA is composed of cells, states, neighborhood and transition rules.

Where,

For each township, the modeling accuracy is calculated as a ratio between the simulated and real urban growth data. Over/underestimation concept is introduced to represent how comparable is the simulated result to the real one. Calibration in this work is meant to find the best set of rule values specific to each township for realistic urban growth modeling. Urban CA is developed largely through trial and error which makes the CA models essentially heuristic. Prediction accuracy for each township is used as a basis for rule calibration.
CA implementation phase
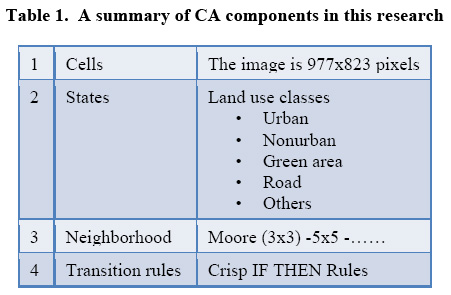
In this research, there are 977×823 pixels as cells. And five different states are considered for each cell, i.e. Urban, Nonurban, Green area, Road, Others. A variety of Moore neighborhoods have been chosen to examine the effect of neighborhood size on the result. Finally, transition rules consist of Crisp IF THEN Rules. A summary of CA components in this research has been shown in the following table
Methodology and Implementation
Yazd city in the center of Iran has been selected for this study. Yazd located at latitude32 and longitude54 of Iran. The accelerated urban development raises the need of simulating the growth pattern to help the municipalities in planning the proper distribution of infrastructure services. The social importance of our work is to understand the urban growth pattern over Yazd.
Data preparation
The data that has been used for the urban growth simulation included two historical satellite images covering a period of nine years. These raw images include two 30 m resolution TM images (1990 and 1999).Yazd City can be find in p162 r38 of landsat image indexing system. All band of satellite image are merged then the images are geometrically rectified to the same projection of Universal Transverse Mercator (UTM) zone 39N. Registration errors are very small represented by values far less than one pixel.
Image Classification
After the images were geometrically rectified and registered spatially to each other, the next step to prepare the images as inputs to the CA simulation algorithm is image classification. According to our purpose of project, the specific classes of image should be recognized. Therefore supervised classification method based on maximum likelihood classification system is used. The five classes (Urban-Road-Green area- Nonurban-Others) defined based on the area and our modeling need.
As MLC need training area, the training area for two images is prepared (Figures 6,7 ).

In defining training are, Some parameter such as signature sepratability , plot scatter, statistical parameter should be mentioned. The report about these parameters and the general classification report were representing in Appendix 1 attached.
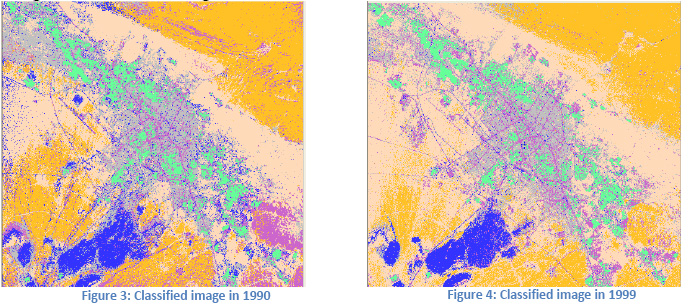
In fig.8,9 the classified image are shown.
Applying cellular automata
The used methodology for this research is as follow.
1. Two images have been read.

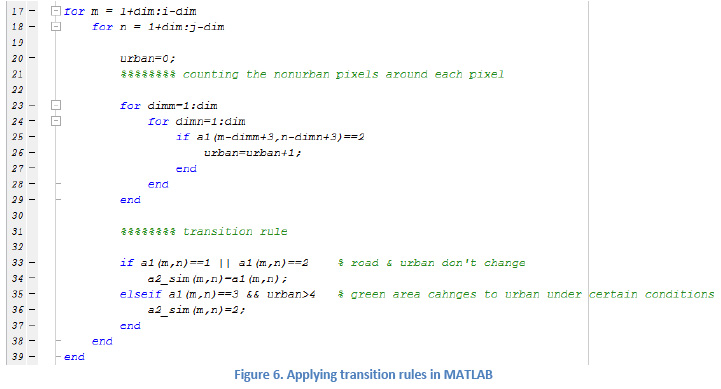
2. The number of “urban” pixels has been count and Then the transition rules have been applied. The transition rules are as below:
a. IF tested pixel under consideration is water, THEN no growth is allowed at this pixel.
b. IF tested pixel under consideration is road, THEN no growth is allowed at this pixel.
c. IF tested pixel under consideration is residential OR commercial (Urban), THEN keep this pixel the same without any change.
d. IF center pixel under consideration is (Green Area) AND there are 4 Urban pixels in the neighborhood, THEN change center pixel to Urban .
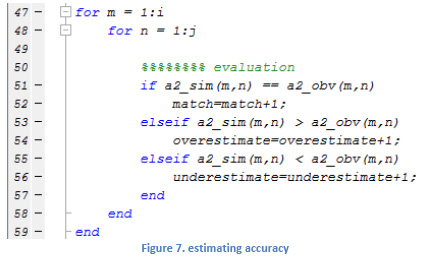
Finally, matched and dismatched (overestimate and underestimate) pixels have been counted to calculate the accuracy as

Model Evaluation and results
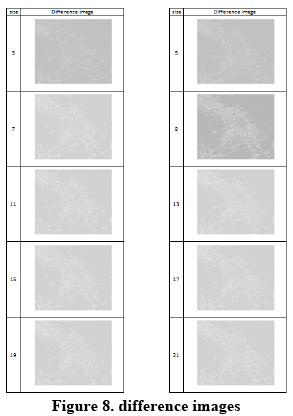
The difference between simulated and observed images has been shown in the following. The white pixels show dismatched cells while the black ones show the match cells.
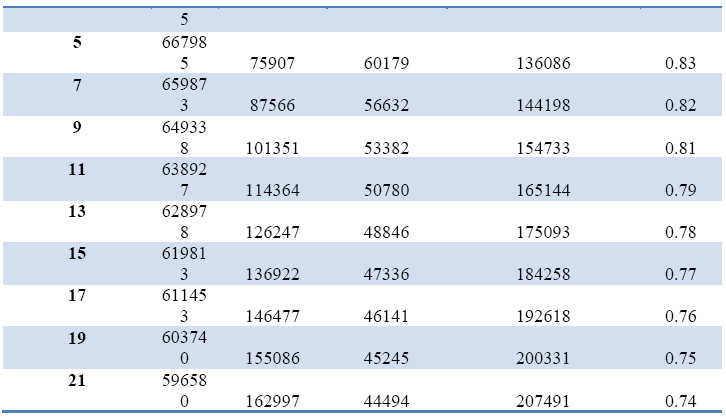
The numerical results for different neighborhood size are as below:

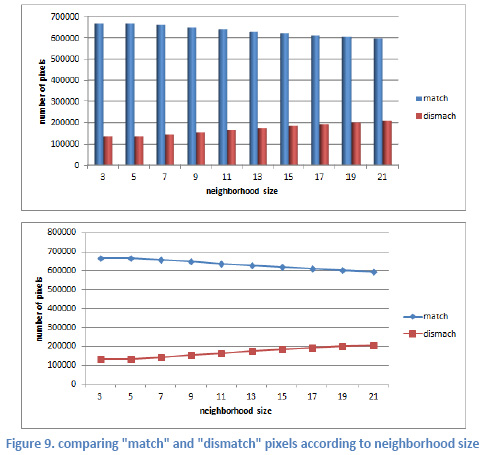
To have more Intuitionistic comparison, the following charts can show us a better comparison:
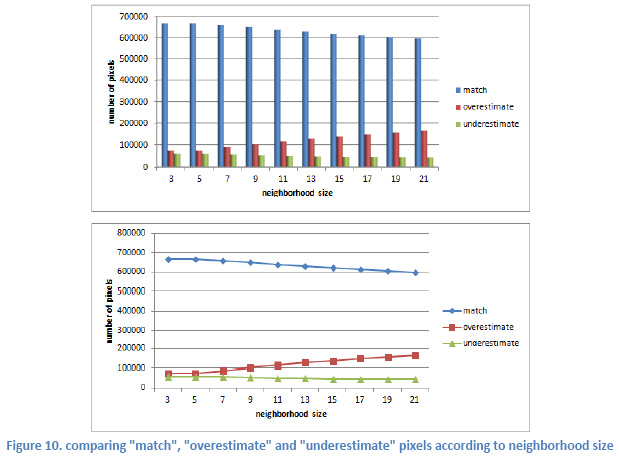
To have a more detailed comparison the following chart will be more useful:
Finally, the total accuracy according to neighborhood size is shown in the following chart:
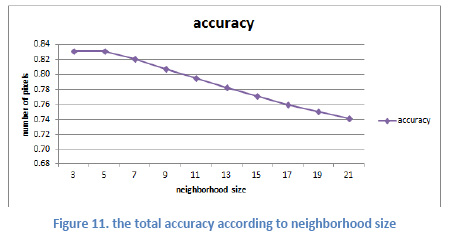
Meaningfulness of the accuracy amounts gained in this research is tested using F-test in statistics. To know more about this statistical test one can refer to statistic books. As summary if F-statistic is more than Fa, v1, v2 then the difference between values are meaningful. The estimated statistic in variance-analysis test for 0.95 and 0.99 recognition level is ∞ while the value of F-statistic for a=0.95, v1= 9 and v2=40 is 2.12 and for a=0.99, v1= 9 and v2=40 is 2.89 so the difference is meaningful.
• k: number of societies
• n: number of observations in each societies
• v1= k-1
• v2=n x k
Conclusions
CA is a useful tool for modeling dynamic environments such as urban areas. As one of the main characteristics of urban growth problem is that each cell status is dependent on its neighbor cell status, CA can be used to model urban growth by using appropriate components. Such a technique has been applied in this research and the results have shown that this technique is reliable for such a problem. One of the main results of this research is that the bigger neighborhood is the less accurate prediction will be. This result shows that each cell state is more affected by nearer cells than the farther ones. The deviation of accuracy numbers is meaningful due to F-test in statistics.
References
[1]Clarke, “Loose-coupling a cellular automaton model and GIS: long-term urbangrowth prediction for San Francisco and Washington/Baltimore,” int. j. geographical information science, vol. 12, no. 7, pp. 699- 714, 1998.
[2] Sharaf Alkheder and Jie Shan, “Cellular Automata Urban Growth Simulation and Evaluation – A Case Study of Indianapolis”.
[3] Paul L Rosin, “Training Cellular Automata for Image Processing,” pp. 195–204, 2005.
[4] Adriana Popovici and Dan Popovici, “Cellular Automata in Image Processing,”.
[5] Hamid Kiavarz moghaddam and Farhad Samadzadegan, “Land Use Change Modeling in Tehran Using Geo Cellular Automata,” in GIS Ostrava 2009, 2009.
[6] Chang-Qing KE, “Urban growth modeling of Jiangning through Cellular Automata,” 2006.
[7] N Ghani, S Abidin, and M Zaman, “Generating Transition Rules of Cellular Automata for Urban Growth Prediction,” INTERNATIONAL JOURNAL OF GEOLOGY, vol. 5, no. 2, 2011.
[8] G Gartner, D Bennett, and T Morita, “Toward ubiquitous cartography. Cartography and Geographic Information Science,” vol. 34, pp. 247–257, 2007.
[9] Khalid Al-Ahmadia, Alison Heppenstallb, and Linda See, “Modeling Urban Growth Dynamics using Cellular Automata and GIS”. |


 (5.00 out of 5)


 (5.00 out of 5)


 (5.00 out of 5)


 (5.00 out of 5)
Leave your response!