| Navigation | |
Selection of Suitable Matching Area in Gravity-Aided Inertial Navigation System
This paper utilizes the Principal Component Analysis (PCA) to integrate gravity fi eld’s local standard deviation, roughness, slope and correlation coeffi cients into one singular weighing indicator for the matching suitability of gravity fi eld, which can synthesize different information of different gravity fi eld’s characteristic with the original information lost within the allowable range. |
 |
|
 |
|
Gravity-Aided Inertial Navigation System (GAINS), which, as its names implies, is using the priori information of gravity field as the auxiliary information to bind the accumulation of positioning error of Inertial Navigation System(INS) [1-2]. GAINS possesses many a dvantages, such as high precision of positioning, favorable concealment, strong independence, etc. The positioning effects of GAINS is mainly associated with the performance of matching algorithm, the resolution of gravity reference map, the measurement accuracy of gravimeter and the selection of suitable matching area[3-4].
Different areas have different gravity information. Generally speaking, the matching algorithm of GAINS achieves better perform- ance in areas with obvious gravity information and achieves unfavorable performance in areas with indigence of gravity information [5]. Thus the selection of suitable matching area becomes a crucial step for GAINS. It is meant to provide guidance for vehicle route planning based on some kind of criterion like the value of one specific gravity characteristic, or an organic integration of several gravity characteristics [6-7].
This paper aims at provide us with a method on how to select the suitable matching area for GAINS. First, it utilize the Principal Component Analysis (PCA) to integrate gravity field’s local standard deviation, roughness, slope and correlation coefficients into one singular weighing indicator, then segment the gravity reference map into suitable matching area and unsuitable matching area by setting a threshold for the weighing indicator. Finally, experiments were carried out by utilizing Terrain Contour Matching (TERCOM) algorithm with performance index of Mean Square Error (MSD) to verify the proposed method. The experimental results validated the reliability and feasibility of the proposed method.
Local Characteristic Parameters of Gravity Field
This paper chose the gravity field’s local standard deviation, roughness, slope and correlation coefficients as the input information for PCA, and the calculation results of those parameters at point (i,j) were obtained by moving the local computation window that has the size of m × n m × n (The value of m and n are usually 3 or 5). The formulas are expatiated in this section.
Standard Deviation of Gravity Field
![]()
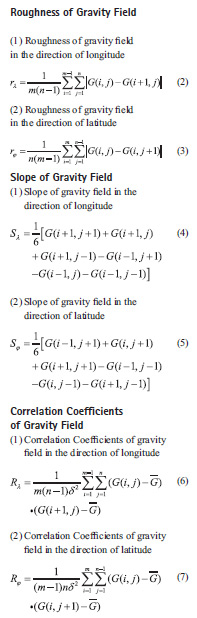
Utilization of the above formulas can enable us to obtain the value of corresponding characteristic parameters on every gridding point in gravity reference map [8-10].
Fundamentals of PCA
PCA is a simple, non-parametric method of extracting relevant information from confusing data sets. It is often been used to reduce a complex, correlational data set to a group of lower dimensional and independent comprehensive indexes, which in some degree can reveal the hidden, simplified dynamics that often underlie it[11].
Mathematical Model of PCA
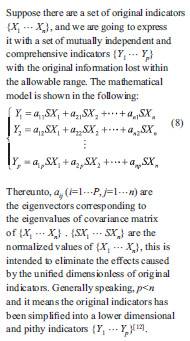
Procedures to carry out PCA
(1) Select the original indicators based on the demands of studied problem.
(2) Normalize the original indicators and calculate out the covariance matrix of it.
(3) Calculate out the eigenvalues of covariance matrix and its corresponding eigenvectors.
(4) Determining the expressions of principle components based on the eigenvalues and eigenvectors.
(5) Calculate out the final one comprehensive indicator and utilize it to conduct the research of the problem [13].
Experiments
Experimental data
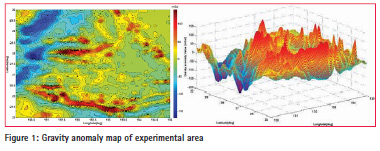
The gravity background map can be gravity anomaly map or gravity gradient map, in this paper we choose the gravity anomaly map as the reference map because there is no public data of global gravity gradient.
The gravity anomaly data utilized in this paper were downloaded from the website of University of San Diego, it covers the range of 25°~30°N, 130°~135°E and owns the resolution of . The maximum value of the gravity anomaly in this area is 152.5mGal and the minimum one is -169.6mGal.
The data we downloaded are scattered point data, and has been processed into grid data in order to make it convenient for utilizing [14-15]. The gravity anomaly contour map has been shown in Figure 1.
Gravity Field’ Characteristic Parameters processing with PCA
This paper chose the gravity field’s local standard deviation, roughness, slope and correlation coefficients as the original indicators. And they have to be calculated out before the processing of PCA carry out. The formulas of calculate these Gravity Field’ Characteristic Parameters has been given out in Section1. As the calculation of these Characteristic Parameters is not the main purpose of this paper, we give out the calculation results with PCA directly.
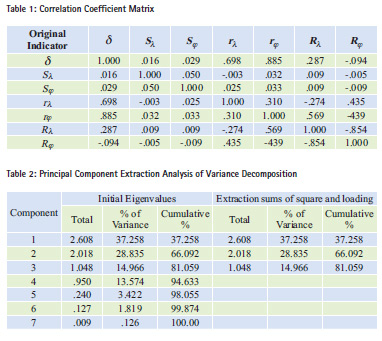
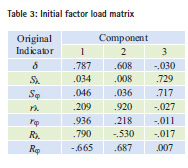
Table 1 shows the correlation coefficients among the seven selected characteristic parameters. And larger values means stronger correlations between the corresponding two indicators.
Table 2 shows that there are three eigenvalues larger than 1, it means that the seven original indicators can be reduced into three principal components.
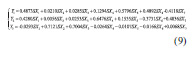
The coefficients to transform the seven original indicators into three principal components can be obtained through divide the three set of data showed in this table by the square root of its corresponding eigenvalues ![]() and the transformation formulas are shown as follows:
and the transformation formulas are shown as follows:
The three principal components can be further simplified into one final comprehensive indicator based on the percentages that their corresponding eigenvalues accounted for the sum of the three eigenvalues. By multiply
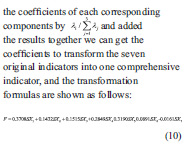
F Is the final comprehensive indicator that measure the richness of gravity field information, and concrete status of the comprehensive indicator of the experimental area in this paper are shown in Figure 2.
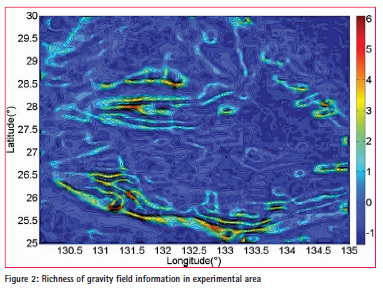
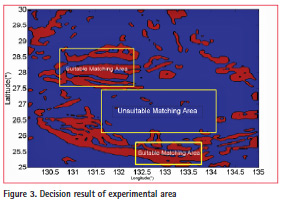
As is shown in Figure 2, larger values of the final comprehensive indicator means more abundant gravity field information. The maximum value of the final comprehensive indicator in this experimental area is 6.4781 while the minimum one is -1.3580, and the average value goes to 5.8098e-09, almost equals to 0. In order to raise the standards for suitable matching area appropriately, we choose a value that are a bit larger than the average value of the final comprehensive indicator, which goes to 0.5. The decision results are shown in Figure 3.
In Figure 3, areas with red background are the suitable matching areas while the blue parts are the unsuitable matching areas.

Principle of TERCOM algorithm with MSD
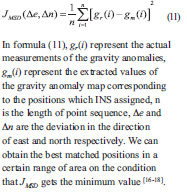
TERCOM algorithm with performance index of MSD is utilized in this section to verify the reliability and feasibility of this proposed method. And the calculation formula is shown below:
Experimental Conditions
We choose four trajectories in suitable matching areas and unsuitable matching areas respectively, each simulated trajectory contains 10 waypoints and owns the sampling interval of 10 minutes. The vehicles sailed along the northwest or northeast directions and the speed is 12 n mile/hr and 10 n mile/hr in the direction of longitude and latitude respectively. The random errors of positions assigned by INS were 0.12 n mile in both directions [19].
The errors of gravity anomaly measurements are 3mGal, which contains the measurement error and the errors in digital making [20].
Experimental results
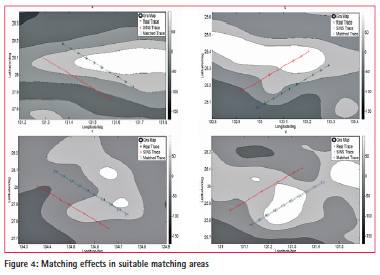
The matching effects in suitable and unsuitable matching areas are shown in Figure 4 and Figure 5 respectively.
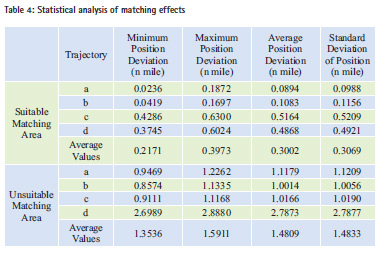
The comparison of the two figures (Figure 4 and Figure 5) roughly shows that the matching effects of the four trajectories in suitable matching areas is better than that in unsuitable matching areas for the former gets smaller position deviations. More accurate statistical analysis of matching effects are shown in the following Table 4.
Statistics in Table 4 shows that the four matched trajectories in suitable matching areas gets smaller values of Minimum Position Deviation, Maximum Position Deviation, Average Position Deviation and Standard Deviation of Position than that in unsuitable matching areas. And the average Standard Deviation of Position of the four matched trajectories in suitable matching areas is about 1.1-1.2 n mile, which is smaller than that in unsuitable matching areas.
Conclusion
This paper utilizes PCA method to simplify the selected characteristic parameters into one comprehensive indicator, which can synthesize different information of different gravity field’s characteristic with the original information lost within the allowable range. Experimental results shows that the average Standard Deviation of Position of matched trajectories in suitable matching areas is 0.3069 n mile, which is smaller than 1.4833 n mile in unsuitable matching areas. The experimental results validated the reliability and feasibility of the proposed method.
References
[1] Li, S.S. Research on the Theory and Method of Underwater Gravity- Aided Inertial Navigation System (In Chinese). A Dissertation for the Degree of D. Eng., Zhengzhou, PLA Information Engineering University. 2010
[2] Zhang, H.H. Research on the Key Technologies of Underwater Gravity Field Aided Navigation and Positioning (In Chinese). A Dissertation for the Degree of D. Eng. Ha’erbin, Harbin Engineering University. 2013
[3] Jircitano, Albert, and D. E. Dosch. “Gravity aided inertial navigation system (GAINS).” Institute of Navigation, Meeting US, 1994:221-229.
[4] Javed, Waqas, S. Ghani, and N. Elmqvist. “GravNav: Using a Gravity Model for Multi-Scale Navigation.” The Workshop on Advanced Visual Interfaces AVI 2012:217–224.
[5] Bishop, Garner C. “Gravitational field maps and navigational errors. “International Symposium on Underwater Technology.2000:149-154.
[6] Tao, Zhang, et al. “Selection criteria for matching area in terrain aided navigation based on fuzzy decision.” Journal of Dalian Maritime University 35.1(2009):5-8.
[7] Liu, Fanming, and J. Yao. “A local analysis method of marine gravity aided navigation area.” Optoelectronics and Microelectronics (ICOM), 2013 International Conference on IEEE, 2013:5 – 9.
[8] Cheng, Li, Y. J. Zhang, and T. J. Cai. “Selection criterion for matching area in gravity aided navigation.” Journal of Chinese Inertial Technology (2007).
[9] Yan, Li. “Research on the selection of suitable matching area in the gravity aided navigation.” Geoinformatics 2007 International Society for Optics and Photonics, 2007:67523U-67523U-12.
[10] Cai, Ti Jing, and X. W. Chen. “Selection criterion based on analytic hierarchy process for matching region in gravity aided INS.” Journal of Chinese Inertial Technology 21.1(2013):93-96.
[11] Shlens, J. “A TUTORIAL ON PRINCIPAL COMPONENT ANALYSIS Derivation, Discussion and Singular Value Decomposition.”Eprint Arxiv 58.3(2003):219-226.
[12] Zhang, W.L. Operation and application of principal component analysis in SPSS. Market Research (12), (2005):31-34.
[13]The application of principal component analysis in SPSS. http://blog.sina.com.cn/s/ blog_66239fdb01017jd7.html
[14] National Geospatial-intelligence Agency [EB/OL].http://earth-info. nga.mil/GandG/wgs84/gravitymod/ egm2008/egm08_wgs84.html, 2014
[15] Satellite Geodesy at the Scripps Institution of Oceanography, University of California San Diego [EB/OL]. http://topex.ucsd.edu/, 2014
[16] Xiong-Wei, L. I., J. Y. Liu, and G. H. Kang. “Development and application of TERCOM elevation-aided navigation system.” Journal of Chinese Inertial Technology 14.1(2006):34-40.
[17] Baker, By W, and Clem. “R:”Terrain Contour Matching (TERCOM. “Primer,” ASD-TR77-61, Aeronautical Systems Division, Wright-Patterson AFB 2010.
[18] Wiener, Thomas F. “Terrain Contour Matching (TERCOM): A Cruise Missile Guidance Aid.” Technical Symposium 1980:10-18.
[19] Tong, Yu De, S. F. Bian, and B. Ji. “Real-time Maximum Correlation Matching Based on Approximated Local Gravity Map (In Chinese).” China satellite navigation Academic Annual Conference 2012:493-503.
[20] Yan, Li. “A Gravity Matching Algorithm Based on TERCOM.” Geomatics & Information Science of Wuhan University (2009): 261-264


 (3 votes, average: 3.67 out of 5)


Leave your response!