| GNSS | |
Performance measurement of EGNOS Integrity and Continuity
The analysis presented in this paper will show whether EGNOS performance is in line with the ICAO SARPS for aircraft LPV approach procedures |
 |
|
 |
|
 |
|
On March 2, 2011, the ESSP declared EGNOS’ Safety of Life (SoL) signal officially available for aviation with the authorization from the European Commission (EC) to provide the service. From that moment on the EGNOS SoL service was provided openly and freely accessible without any direct charge and was tailored to safety-critical transport applications in various domains, most notably (civil) aviation applications. The service was declared compliant with the aviation APV-I (Approach with Vertical Guidance) requirements, as defined by ICAO in ANNEX 10 [1]. As a result, at various airfields within the EGNOS service area, air navigation service providers (ANSPs) started designing, validating and implementing EGNOS-based approach procedures, e.g., within the frame of the GSA funded ACCEPTA project. It is expected that within a few years, as was the case for WAAS in the US, several hundreds or even more aeronautical approach procedures based on EGNOS guidance will be available. As a result, the provided performance of this navigation system, especially its integrity and continuity-of-service, will become crucial for the safety of civil aviation within Europe. The EGNOS SoL service performance achieved, together with the system architecture, Signal-in-Space (SiS) characteristics and organizational framework that were laid down in the ‘EGNOS Safety of Life Service Definition Document’ [2], published by the European Commission, the latest issue 2.0 being published in June 2013. Within this document, the EGNOS SoL performance is validated at a high level versus ICAO SoL service performance requirements for APV-I.
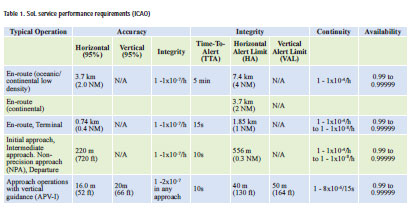
Of the ICAO defined key performance indicators (KPI) accuracy, availability, integrity and continuity (see table 1), the latter two are the most difficult to assesscontinuity because of its high requirements (1-8×10⁻⁶/15s) and complicated concept and integrity because of its extremely high requirement of 2×10⁻⁷ in any approach of 150 seconds. This latter KPI is indeed very difficult to quantify-given the duration of 150 seconds per approach and assuming one approach at a time that all the time it turns out that an integrity failure may occur once every 23.8 years on average. Testing the EGNOS system by collecting data over 23.8 years is far from practical and still insufficient from a statistical point of view. So one needs to invent a way to do integrity tests on the basis of a limited amount of data collected within an acceptable observation time. Such a method for EGNOS integrity validation was developed by NLR, Delft University of Technology, Integricom and Science and Technology [3], [4] and implemented as a GNSS integrity validation tool called GIMAT. In [2] EGNOS, continuity was determined for the complete EGNOS service volume based on EGNOS broadcasted messages, ephemerids and clock information of all visible PRNs, while assuming a fault-free receiver operating in a nominal atmospheric environment. This however, raised the question: ‘What would be the continuity and integrity performance including a (high-end) receiver in the loop, while operating under non-nominal environmental conditions, i.e., during high ionospheric activity?’ Is EGNOS still compliant with ICAO requirements while taking these conditions into account? Concerning the integrity KPI in [2], only the following statement was made: ‘The EGNOS integrity is compliant with the integrity requirements specified in Table 1(ICAO) for APV-I’. This means that neither a method of how this integrity KPI is measured nor a distribution of the actual integrity performance over the EGNOS service area is given.
NLR, as an independent aeronautical research institute is contributing to GNSS performance monitoring, as part of its mission to improve safety in civil aviation. Given that NLR has the right tools available to validate integrity performance, an activity was started to verify the claim stated above. As a result, both integrity and continuity KPI were measured and validated with receiver and atmospheric environment in the loop.
This paper provides an analysis of EGNOS performance in order to identify whether its integrity and continuity performance is in line with the ICAO SARPS for aircraft APV-I approach procedures. The analysis will give insight in the EGNOS integrity and continuity performance distribution within the EGNOS Service Area. The ESSP EDAS service, providing archived EGNOS messages and RIMS station observables, is used as the data source for this investigation.
Concept of continuity and integrity
EGNOS has been designed and validated for ICAO’s APV-I SoL service. Therefore, it shall comply with the performance as specified for APV-I in Table 1. In this section, the details of the GNSS integrity and continuity KPIs definitions will be addressed.
Integrity Concept
In general, integrity is a measure of the trust that can be placed in the correctness of the information supplied by a given system. Integrity includes the ability of a system to provide timely and valid warnings to the user (alerts) when the system must not be used for the intended operation. In order to quantify integrity – which is needed to validate integrity as a KPI versus requirements, a number of definitions and related parameters are in place:
• Protection Levels (Horizontal and Vertical protection levels HPL and VPL) represent an upper bound of the error. A detailed description of how Protection Levels are to be computed by the receiver for EGNOS can be found in Appendix J of the RTCA SBAS MOPS [5].
• Alert Limits are the error tolerances not to be exceeded without issuing an alert [1]. Horizontal and vertical alert limits (HAL and VAL) are defined for each operation, e.g., for APV-I, these are 40 m (HAL) and 50 m (VAL).
• Integrity Event occurs when the navigation system error (i.e., Horizontal Position Error HPE and Vertical Position Error VPE) is larger than the corresponding Protection Level: HPE > HPL or VPE > VPL for some time, while the system does not trigger an alert within the Time To Alert (TTA). Such event is also called a Misleading Information (MI) event, where a distinction is made between MI where Protection Level and Position Error are both either larger or smaller than the Alert Limit and the Hazardous Misleading Information (HMI) condition where the Protection Level is smaller than the Alert Limit, while the Position Error is larger than the Alert Limit. In the latter case, the user will get the erroneous indication that the system can be safely used.
• Integrity Risk is the probability that the position error is larger than the protection level, i.e., HPE > HPL or VPE > VPL, while the user is not warned within the TTA.
The EGNOS system (combination of its Ground Segment and Space Segment) is declared approved for SoL applications, provided that the User Segment is also certified for SoL applications. For aeronautical users, this means that certified SoL Equipment Class shall be used, as specified in [5]. This paper validates whether EGNOS is providing the integrity risk performance under operational conditions (including User Segment and signal propagation through the atmosphere) that the system says it is providing:
![]()
This means that in this paper, the system is validated on the condition of Misleading Integrity Information (MII), thus validating whether the P(MI) that EGNOS provides is indeed compliant with requirements. It should be noted that non-compliance of EGNOS PMI,OP could be determined on statistical basis even if no single MI event is found.
Continuity Concept
Continuity of service of a system is defined in [2] as the capability of the system to perform its function without unscheduled interruptions during the intended operation. It relates to the capability of the navigation system to provide a navigation output with the specified accuracy and integrity during the approach, assuming that it was available at the start of the operation.
The SoL performance requirement (ICAO) in the context of APV-1 operations requires the probability of a loss of continuity to be less than 8×10⁻⁶ for any 15 second period [1]. To validate continuity as a KPI versus requirements, the definitions of Protection Levels and Alert Limits as defined for integrity are relevant. Continuity is provided when {HPL< HAL AND VPL < VAL} at the start of the defined period is continued throughout the total period without any moment of turning into non-availability {HPL > HAL OR VPL > VAL}.
Although this definition for continuity is quite straightforward, it has led to different algorithms. The algorithm used here implements the continuity risk for APV-I as specified by the EUROCONTROL APV Working Group [10]: ‘EGNOS APV-I Continuity Risk is defined as the result of dividing the total number of single continuity breaks using a time-sliding window of 15 seconds by the number of samples with valid and available PA navigation solution. A single continuity break occurs if the system is available at one epoch and becomes not available during the following 15 seconds.’ The algorithm estimates all sliding windows containing a continuity event which occurs when:
![]()
When a continuity event occurs, 15 sliding windows are affected with a continuity break. This leads to the following ‘average continuity’ algorithm that was used (assuming epochs of 1 second).
![]()
Where Nd represents the total number of continuity events, and Ntotal is the total number of epochs in the measurement set (which corresponds to the total number of time slices in the measurement set). The obtained continuity risk according to this algoritm is considered as conservative.
For determining the 95% confidence interval of the obtained continuity risk, the bootstrapping technique [9] is applied on the obtained data set.
Note that the use of the Extreme Value Theory to estimate the continuity risk has been considered. However, the measurement set contains a sufficient number of non-continuity events which lessens the need for such a technique.
Extreme value theory
Scientific Background
Extreme Value Theory (EVT) was developed quite recently, but already well-established and mature field in statistics that provides statistical methods allowing for the estimation of the probability of events that lie beyond the observed range of the data [6]. The application areas in which EVT have been successfully used are numerous and include hydrology (flood frequency analysis), finance, insurance, meteorology (extreme wind strength, rainfall, and earthquake risk assessment) and many engineering areas, e.g., corrosion and fatigue prediction [7].
EVT is applicable regardless of the underlying error distributions of the measurement data, relieving the need for strong a priori assumptions (such as assuming Gaussian error distributions). The properties of the tail of the error distributions can be derived from the measurement data, so that the data can be meaningfully extrapolated into the region of MI, even when no sample values in this region are available. By finding a databased description of the tail of the error distribution, the actual system integrity can be estimated without the need for assuming particular error distributions.
Broadly speaking, there are two principle kinds of models for extreme values. The first group of models is based on the identification of the largest observation per block of data and are therefore called block-maxima models. In our earliest efforts, we used this model for EGNOS integrity verification [8]. A second group of EVT models contains the peak-over-threshold (POT) models, which model all observations that exceed some threshold. These POT models were considered to be the most useful because of their more efficient use of the limited number of extreme values. The latter approach has therefore been chosen for the GIMAT tool. Although it is not the purpose here to describe the GIMAT functionality in detail, for correct understanding of the followed approach of EGNOS integrity validation is briefly described below.
The GIMAT tool functionality
GIMAT (GNSS Integrity Monitoring and Analysis Tool) is a software implementation of the EVT-based GNSS integrity estimation. The tool was primarily designed to validate EGNOS integrity performance, however validation of the integrity concept and performance of Galileo SoL service and GBAS GAST-C and D can be supported as well. In order to make the GIMAT tool more complete, also other more straightforward GNSS KPIs such as accuracy, availability and continuity-ofservice KPIs are provided. In addition to position domain integrity estimation, also range domain satellite-pseudo range based integrity determination is available but not used in this study.
Within the POT class of EVT models, various styles of analysis exist. The fully parametric model based on the Generalized Pareto Distribution (GPD) was conceptually the most straightforward. The GPD is a three-parameter distribution with the following cumulative distribution function (cdf) for some error e (e >μ ):
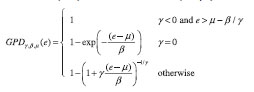
In this equation, the location parameter µ will always be zero when fitting peaks over a threshold. Since ß acts as the scaling parameter, the most important parameter is γ, the so-called shape parameter, which largely determines the behavior of the tail. For positive values of γ, the cdf has a heavy tail, while γ=0 corresponds to an exponential tail. In the case that γ is negative, the tail has a finite endpoint and the probability density function becomes zero for errors that exceed this endpoint, implying that larger errors simply cannot occur.
In the earlier section, the threshold was mentioned for determining the peakover- threshold samples to be used for determining the distribution’s tail behavior. When selecting this threshold, a compromise has to be made between choosing a sufficiently large threshold to make the distribution’s asymptotic approximation hold and choosing a sufficiently small threshold to obtain sufficient excess data to accurately estimate the parameters β and γ. Unfortunately, no automatic threshold selection algorithm providing satisfactory performance is available yet. The threshold is typically selected by human intervention, based on graphical data analysis of a so-called ‘Mean Excess plot’ (ME), together with stable behavior of ß and γ over a certain region [4].
For a correct estimate of the integrity risk performance, best is to use independent value samples. This is especially true since peaks always come in groups of samples showing considerable dependency. For this reason, the set of peak-over-threshold value samples are filtered, making the set statistically independent. Traditionally, data dependency in time series is investigated using the autocorrelation function. In GIMAT, for the tail, a more suitable approach of dependency reduction was used that avoids unnecessary loss of data: the assumption that the time of occurrence of independent observables exceeding threshold should follow a Poisson distribution. This fact can be used to determine a minimum time interval K that one needs between two samples to consider them as being independent, based on Poisson statistics behavior. Consider all data samples with errors exceeding a certain threshold value. When there are N such samples in total, define the fraction of ‘large errors’ that are at most a time period K apart as:
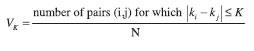
In the case of independent samples (Poisson distribution), the expected value E{Vk} is linear in K. When one draws a graph of K versus VK, the graph should therefore approach a straight line above values KT of K for which independence is obtained, while for smaller K, the graph will be either curving upwards or downwards which indicates some kind of dependence. De-clustering to obtain a set of independent observations can thus be performed as follows: use only the largest observations in each cluster, where the large errors are said to belong to the same cluster when they are at most a period KT apart.
Finally, having information on the confidence level and intervals of the determined integrity probabilities is a necessity for making sound statements on estimated (non-) integrity probabilities. The confidence level or interval is not a system parameter, however generally relates to the quality and quantity of the measurement data set. Most straightforward would be to repeat the experiment many times and determine the confidence interval based on the distribution of the outcomes. In this test, this approach is not very practical or even impossible, therefore other methods need to be investigated. When developing the tool, two distinct methods were evaluated for obtaining 2σ confidence intervals associated with the obtained probabilities: resampling bootstrapping [9] and the Gauss-Newton iteration approach. Dividing a period into a few sub-periods of time and applying a Gauss- Newton iteration on these time periods showed that confidence intervals based on this approach seemed to be overly optimistic. Bootstrapping based confidence intervals on the other hand showed quite reliable and conservative, with additional advantage of this method being its great simplicity together with lack of need for strong assumptions. As a result, it was decided to use bootstrapping for confidence level determination in GIMAT. In our study, we used 100 bootstraps for determining confidence intervals of determined PMI for each RIMS location. Thus a range of 100 PMI distributions result, see Figure 1. The five highest PMI values determine the upper 95% confidence interval of the distribution.
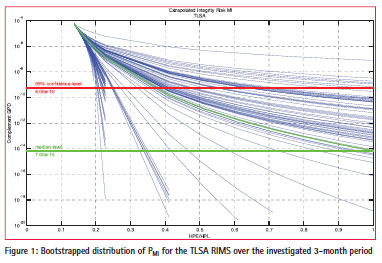
The GIMAT tool has been used a few times already, e.g., in [3], in which its capabilities were successfully shown. It has also become clear that for obtaining narrow enough 2σ confidence intervals, at least a time period in the order of three months of collected observables needs to be used.
Selected measurement approach
Baseline for our approach was to use data sources and tools which are widely accepted by the GNSS community as de facto standards and of excellent quality.
For Continuity and Integrity performance calculations, the following measurement conditions and assumptions are applicable:
• Selected time period:
• The time period 2013-10-20 to 2014-01-31, (104 days in total) was selected, in order to obtain acceptable small confidence intervals. It is assumed that this period provides a robust set for Extreme Value statistics calculations. In addition, in this particular time interval, the sun has reached its 24th cycle solar max activity, which is interesting for the assessment of the influence of ionospheric activity on EGNOS performance.
• As GNSS data source, data from 34 EGNOS RIMS from the EDAS archive were used for a number of reasons:
• RIMS are evenly spread over the EGNOS Service Area;
• RIMS provide an excellent quality of observables, as they are the ground segment of the EGNOS SoL service;
• In the processing chain, EDAS applies very accurate techniques to minimize receiver or local errors (e.g., multipath, cycle slips), and thus, approximates a fault-free receiver;
• The EGNOS messages provided by EDAS are identical to the GEO broadcasted messages, however they are not sensitive to discontinuities in the provision of EGNOS SIS (Loss of EGNOS signal).
• KPI performance calculations:
• EGNOS aided PVT and protection level calculations are performed by the PEGASUS tool. PEGASUS is considered as a baseline tool for SBAS aided calculations implementing the algorithms issued according to MOPS [2]. PEGASUS is used for manufacturer-independent verification of augmentation system performance according to ICAO Standards. Since the development of EGNOS and GBAS, the PEGASUS tool was used for its validation.
• Only PVT solutions in mode 4 (APV-1) of PEGASUS are used for analysis.
• Integrity performance calculations using GIMAT (EVT) functionality.
• For continuity KPI performance calculations, no difference is made with respect to the length of the discontinuities, neither their independency. (Two successive discontinuities are independent if in between the system was continuously available (xPL< xAL) continuously for a period of 15 seconds or more.
• Using GIMAT, only the PMI is investigated. When we prove EGNOS PMI to be compliant with ICAO requirements, then its PHMI is compliant as well, since HMI events are a sub-set of MI events .
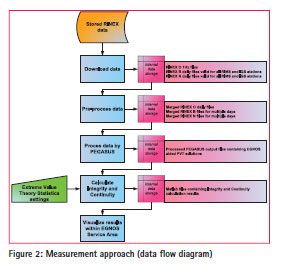
Figure 2 shows the selected measurement approach for Continuity and Integrity performance calculations. The RINEX data files (O/B/N) were downloaded from EDAS for each of the selected EGNOS RIMS. Few IGS observables (RINEX O) were downloaded from the CDDIS server (RINEX B/N provided by EDAS since the data is stationindependent) as an independent reference.
Subsequently, RINEX data files were merged into larger files to calculate EGNOS aided PVT solutions on a daily basis using PEGASUS ‘Convertor’ and ‘GNSS_Solution’ modules.
Finally, after filtering the data for the correct PVT mode (EGNOS aided PVT for Approach Procedures with Vertical guidance APV), Integrity and Continuity performance calculations were performed using the GIMAT methodologies described in chapter 2 and chapter 3 of this paper. For visualisation, the results are translated to a map-layer, which enables the integration into a geospatial data infrastructure. The results are assessed and visualized via a dedicated web interface for GNSS KPI performance parameters (http://gis.nlr.nl/flexviewers/gnss/).
Results
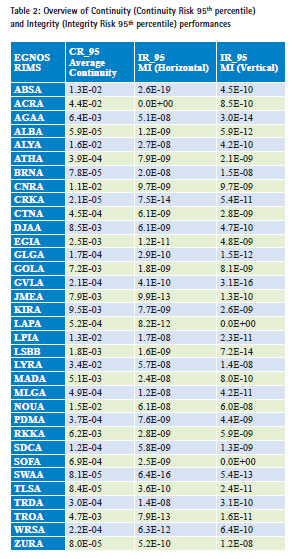
Table 2 shows an overview of both obtained Continuity and Integrity results at EGNOS RIMS locations spread over the EGNOS Service Area.
Continuity Performance Results
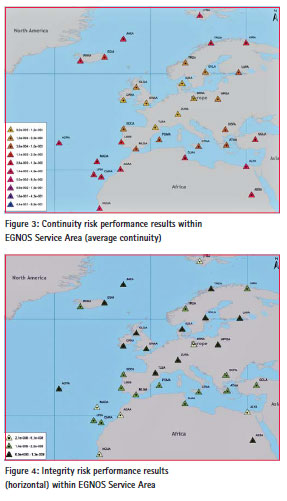
From Table 2 and Figure 3, it can be observed that the Continuity results degrade from the middle towards the edge of the EGNOS Service A rea. This corresponds to simulation results presented in [2]. For all stations, the ICAO requirement for Continuity is not met. Continuity KPI performance calculations based on observables from European IGS stations showed similar results.
Integrity Performance Results
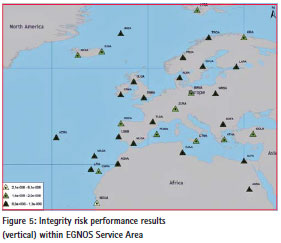
From Table 2 and Figures 4 and 5, it can be observed that the ICAO requirement for Integrity is met within the entire EGNOS Service Area. Furthermore, it can be observed that the Integrity risk performance results, in both horizontal and vertical directions, at the edge (i.e., Northern part) are not significantly worse than in the middle as it was in the case for Continuity.
Integrity KPI performance calculations based on European IGS data showed similar results.
Results With Respect To Ionospheric Storm Conditions
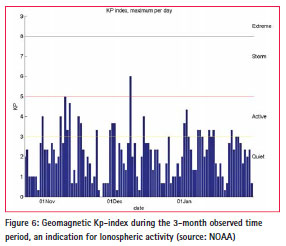
The selected time period was located within the solar max period of the 24th solar cycle. For that reason, the opportunity was taken to investigate influence of high solar activity on EGNOS performance. In order to investigate EGNOS performance under adverse atmospheric (ionospheric storm) conditions, PVT and protection levels calculations for two days were compared by PEGASUS: one day with high ionospheric activity (‘ionospheric storm’ category), and one day showing nominal ionospheric activity. This selection was based on the geomagnetic Kp-index, an indicator for solar activity at global scale . Figure 6 shows that December 8, 2013, was the only day in this period for which high ionospheric activity was measured whereas December 13, used for comparison, showed no significant ionospheric activity.
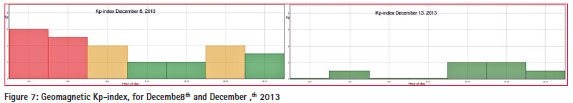
As can be seen in Figure 7, most (worldwide) geomagnetic activity were present only during night time in Europe. As a result, no significant increase in Total Electron Content (TEC), see Figure 8, or – probably more important – no increase in amount of TEC – irregularities (not shown), were noticed for this day. As a result, no significant ionospheric effects were expected for December 8, 201 3.
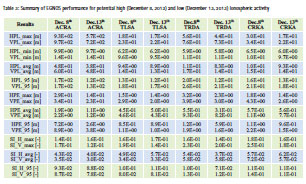
Table 3 shows statistics about the EGNOS performance results for both days at four RIMS locations (‘ACR’, ‘TLS’, ‘TRD’ and ‘CRK’). As can be seen f rom Table 3, horizontal and vertical protection levels, position errors and Safety indices (SI) are slightly worse under potential high ionospheric activity compared with nominal conditions, but not dramatically so. No events of MI were observed. The preliminary conclusion therefore could be that EGNOS performance is adequate under ionospheric activity conditions. However, as only weak events could be observed within this time period, more research on this topic is required under more severe ionospheric activities in order to provide more evidence of EGNOS resilience to ionospheric activity.

Conclusions and recommendations
This paper addressed the GIMAT EVT and additional methodologies (e.g., bootstrapping) and assessed the results for EGNOS Continuity and Integrity performance with receiver and atmosphere in the loop, based on RIMS observables throughout the entire EGNOS Service Area. Thereby, Extreme Value statistics has proven to be a practical method for Integrity monitoring activities. Additional attention was given to EGNOS performance monitoring during high ionospheric activity conditions relative to nominal activity.
The EGNOS Continuity performance results are in line with simulations described in [2]. The Continuity results degrade from the center towards the edge of the EGNOS Service Area. Continuity results are not compliant with the ICAO Continuity requirement for APV-I. (This, however is expected to be only a timely problem due to the advent of Galileo SV’s, which will improve DOP values.)
The EGNOS Integrity risk performance results at 95% confidence level are in line with the ICAO Integrity requirement for APV-I within the entire Service Area for both horizontal and vertical directions. Thereby, the Integrity risk performance results within the core and at the edge of the Service Area are at a similar level. In addition, over the investigated 3-month period, for all the 34 RIMS stations not a single MI event was observed.
During potential ‘ionospheric storm’ conditions of only limited severity (on December 8, 2013), EGNOS showed protection level and position error performances that were close to those under nominal conditions. Thus, limited reduction in KPI performance (accuracy, availability, continuity and integrity) relative to nominal ionospheric conditions was indicated. However, such investigation is a study on its own and more thorough investigations are required under more ‘favorable’ ionospheric storm conditions to confirm this indication.
With respect to the conclusions, the following recommendations are made:
• Like for all other KPIs, frequent monitoring of integrity performance should be done throughout the Service Area. For this, integrity monitoring EVT statistics is a useful approach.
• Definition of continuity does not uniquely lead to an algorithm for continuity KPI determination. Authorities (ICAO) are recommended to define a standardized algorithm for continuity determination in order to enable validation versus ICAO requirements.
• It is advised for the calculation of KPIs to take confidence intervals into account (e.g., by bootstrapping) as it was applied for the results presented in this paper.
Acknowledgements
The Netherlands Space Office (NSO) partly funded the development of the GNSS Integrity Monitoring and Analysis Tool (GIMAT). GIMAT has been developed by a Dutch consortium comprising of Delft University of Technology, Integricom, National Aerospace Laboratory (NLR) and S&T. ESSP is acknowledged for their useful support in provision of EDAS RIMS data.
References
1. ICAO, “Annex 10, Aeronautical Telecommunications”, Volume 1: Radio Navigation Aids, Amendment 84, Published July 20, 2009, effective November 19, 2009.
2. EGNOS Safety of Life Service Definition Document, European Commission, Issue 2.0, June 2013.
3. H. Veerman, A. van Kleef, D. Imperato, C. Tiberius, S Verhagen, B. Ober, A. Bos, A. Mieremet, “Verifying EGNOS Integrity in Practise: – a tool based on statistical Extreme Value Theory”, NAVITEC, December 2012.
4. P.B. Ober, D. Imperato, S. Verhagen, C. Tiberius, H. Veerman, A van Kleef, F. Wokke, A. Bos, A. Mieremet, “Empirical integrity verification of GNSS and SBAS based on the Extreme Value Theory”, NAVIGATION, Volume 61, No. 1, Spring 2014.
5. Minimal Operation Performance Standards for Global Positioning System / Wide Area Augmentation System Airborne Equipment, RTCA DO-229D, December 13, 2006.
6. S. Kotz, S. Nadarajah, “Extreme Value Distributions: Theory and Applications”, Imperial College Press, 2000.
7. P. Embrechts, C. Kluppelberg and T. Mikosch, “Modelling Extremal Events: for Insurance and Finance”, Volume 33 of Stochastic Modelling and Applied Probability, Springer, 1997
8. H. Kannemans, “The Generalized Extreme Value Statistical Method to Determine the GNSS Integrity Performance”, Technical Report NLR-TP-2010-491, October 2010.
9. A.C. Davidson, O. Hinckley, “Bootstrap Methods and their Application”, Cambridge university Press, 1997.
10. EUROCONTROL Airspace and Navigation Team, APV Working Group / EGNOS SIS Validation Sub Group, ESV/6 WP1, 2005.
11. F.J.P Wokke, H.P.J. Veerman, R. Vidal, M. Kirchner, J. Vilzmann, J. Perez Bartolome, “Key Performance Indicators for Performance Monitoring and Analysis of EGNOS and Galileo”, European Navigation Conference 2008.
The paper was presented at ENC 2014, Rotterdam, April 14-17, 2014


 (7 votes, average: 2.71 out of 5)


Leave your response!