
| Mapping | |
Territorial and topographic analysis for the protection and enhancement of fragile archaeological areas
The carried out activities were aimed at defining the best methodologies for the documentation, analysis, protection and enhancement of the archaeological remains in the territory of Tarquinia |
 |
|
 |
|
Within the “Tarquinia Project” and the “Centro di Ricerca Coordinato”, involving different groups of the Università degli Studi di Milano (Archaeology, Computer Science and Communication, Geoarchaeology, Palaeoanthropology) and the Politecnico di Milano (Architecture and Conservation of Cultural Heritage), the carried out activities were aimed at defining the best methodologies for the documentation, analysis, protection and enhancement of the archaeological remains in the territory of Tarquinia. Within this broad framework, from 2010 the two research groups focused their efforts in the identification of the entire route of the ancient Tarquinia wall circuit and the archaeological structures it contains in order to create thematic maps of the “Pianoro della Civita”. The performed work examined the available historical documentation, proceeding in an extensive analysis of the marks that characterized the area. Given the complex morphology of the area, the ancient emergencies spread over fourteen centuries and the dense vegetation characterizing the slopes, a laser scanner survey using LiDAR technology (Light Detection and Ranging) of the entire area was performed in order to investigate the archaeological objects. These investigations, together with what emerges from the interpretation of the cartographies and about the history of the archaeological analysis and research (Marzullo 2018), made it possible to evaluate and verify the archaeological remains, contributing to the creation of the thematic maps of the ancient Tarquinian city walls. The “Tarquinia Project” (Bagnasco Gianni, 2012; Bonghi Jovino, 2006) was extended to the whole plateau in order to deepen the knowledge of the Etruscan settlement, contextualizing not only the archaeological sites in which the Università degli Studi di Milano worked directly, but also the previous excavations, in a wider topographical context embracing the surrounding territory.
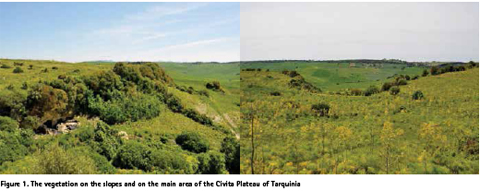
In this regard, thanks to the funding of a “Progetto Ricerca Interesse Nazionale” (PRIN – “Mura di legno, mura di terra, mura di pietra: fortificazioni in Etruria”)1, the project “Mura Tarquiniesi” was started in collaboration with the Politecnico di Milano, in order to evaluate the extension of the ancient city, enclosed in the circuit of the walls, in relation to the morphological characteristics of the plateau, reviewing the structure, the palimpsest of the signs in historical key and the relationship with the settling phases2. The ancient use of the site extends over a chronological period of about fourteen centuries (X B.C. – IV A.D.), if not beyond. For this reason, the performed work examined graphic reproductions, cartographic thresholds and available aerial images, proceeding in an extensive study of the signs that characterized the area, examining not only the aspects more properly referring to archaeological findings, but also the geomorphological and infrastructural ones (Marzullo 2018, pp. 21-48). Given the particular territorial shape and the presence of dense vegetation on the slopes of the plateau and in the flat areas (figure 1), in order to identify and investigate the current archaeological remains, a laser scanner survey using LiDAR technology (Light Detection and Ranging) of the entire territory was performed. This technology, used here for the first time in an Etruscan archaeological area, allowed us to identify every morphological discontinuity of the plateau for the whole knowledge, analysis and preservation of this inestimable heritage.
The acquisition methodology
As is known, the LiDAR technology uses measurement system mounted on airplanes that scans the overflowed field, storing information useful for the knowledge and representation of the territory and of the objects it contains. The raw data, the first output of the aerial survey, is presented as a cloud of points that defines the terrain altimetry and the elements present in it as vegetation, buildings, roads, waterways, etc. The points that contribute to form the cloud were arranged according to the scanning pattern of the instrument, therefore requiring in-depth processing. Regarding these points are known the planimetric coordinates, the altimetry, the intensity of reflection, the classification based on the intercepted surfaces and other indications regarding the characteristics of the flight (Kokalj et al., 2010; Cowley and Opitz, 2012). Generally, the laser scanner is a system used for surveying objects and artefacts and consists of a device that automatically drives, directs and records the impulses of the attached laser range finder that determines the distance between the point of emission of the impulse and the point of reflection on the surface of the intercepted object (Shan and Toth, 2009; Remondino and Campana, 2014).
Since the position of the impulse origin is known, and the angle of direction and the distance are recorded, the set of intercepted points helps to form a cloud of points, a sort of digital cast of the scanned surfaces. In this specific case, to know the position of the point of emission of the pulse, the orientation of the laser and the direction of the emitted beams, it was necessary to integrate an inertial system and a GNSS system useful for the reconstruction of the flight paths. Since the instruments were synchronized one with each other, it was possible to insert in a geo-referenced space the intercepted point by the laser pulse at any time since spatial information was known (for laser scanning techniques used in LiDAR technology and for processing: Shan and Toth, 2009; Cowley and Opitz, 2012; Remondino and Campana 2014).
In addition to the laser scanner instrumentation, on the aircraft there was a digital photogrammetric camera that allowed to perform numerous aerial shoots of the entire archaeological area. These images were processed using image based photogrammetric systems and structure from motion techniques (SfM) in order to obtain a three-dimensional texturized model with high definition details. The model has been verified, from the point of view of dimensions, proportions and precision, thanks to the LiDAR cloud of points and the results obtained have therefore allowed to create a new cartographic support on which to ground all the analytical elaboration of the project.
The application for the archaeological context
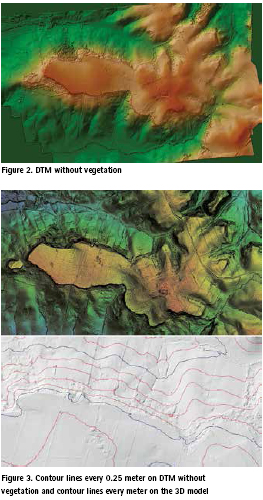
In this specific case, although some areas of the “Pianoro della Civita” are characterized by a thick Mediterranean vegetation, it was possible to obtain a valid result in the acquisition and representation of the morphology of the underlying terrain. This result was obtained thanks to the application of appropriate algorithms and selection criteria (geometric parameters such as maximum permissible gradient and acceptable height differences – Cowley and Opitz, 2012) in order to extract from the point cloud only the information deriving from the surface of the ground. This method enabled the generation of a digital terrain model (DTM – figure 2) able to describe all its three-dimensional trends and in which it was possible to create contour lines with any type of interval, depending on the needs, up to 15-20 centimetres (figure 3).
Therefore, the resulting model has clearly differentiated from any other three-dimensional product obtained starting from the cartography or available aerial image. The quantity and quality of the data collected by the laser scanner had therefore made it possible to realize a high precision DTM and DSM which proved to be extremely profitable in the census of archaeological emergencies on large areas, since any type of anthropization has clearly emerged from the level of the ground. A further advantage is the creation of an updated and metrically correct cartographic base on which the identifiable archaeological structures have been placed, thus being correctly positioned.
In this way all the problems connected to archaeological structure identification and positioning were overcome, criticisms that had invalidated the previous attempts to draft archaeological thematic maps.
In this regard it is important to underline how the only modern cartographies (regional and provincial technical maps and municipal cartographies) could not act as a unique support for such elaborations. This for two main reasons, the first because they represent primarily data already interpreted with a purpose and a level of definition completely different from the one of the project. The second, closely connected to the previous one, concerns all the criticism of metric reliability of these cartographies and the problems linked to the absolute positioning of the information therein contained.
In fact, the data relating to the archaeological remains are often represented in a very general way (given the large scale of these cartographies – 1:5000, 1:10000 and 1:25000) so as not to fully understand their geometric consistency. Moreover, the area has been characterized by archaeological investigations since the beginning of the XVIII century that revealed structures spread all over the plateau and now not easily recognizable except for limited portions that are anyway not represented in the traditional and current maps.
A separate question deserves aerial imagery, both historical and modern. These constitute a clear snapshot of the territory at different times (the first date back to 1938 with numerous attestations to nowadays) and for the territory in question they are a valid and important source of information especially about the evolution of the landmarks. Previous studies regarding the Etruscan territory (E. Wetter e J.P Bradford for Tarquinia: Henken, 1968; F. Castagnoli for Cerveteri: Melis and Serra, 1968) had undoubtedly drawn attention to the possibilities offered by aerial surveys and investigations. However, for the tangible verification of the signs seen through photographic analysis, it was fully demonstrated that the aerial shots could not be enough to identify buried or almost buried remains (Lerici, 1959).
Similarly to what had already been determined in Cerveteri, in fact, if on the one hand this methodology seemed appropriate to show the intensity and extent of archaeological deposits, on the other hand it was not able to locate the structures punctually, unless they clearly discerned portions emerging from the surface.
In the clayey soil of Tarquinia, where the ground has been for a long time subjected to agricultural work, the interpretation of aerial images did not seem suitable to provide definitive results, if not accompanied by further stratigraphic analyses or geophysical investigations.
Coming back to the processing of the three-dimensional data, it was necessary to use algorithms that were not too selective and automatic in discarding the points not belonging to the ground. Due to the morphological and dimensional characteristics of the archaeological structures it was necessary to pay attention to this elaboration phase in order to not confuse the points of possible structures with background noise information and thus automatically delete them (Crutchley and Crow, 2009; De Laet et al., 2009; Kraus and Pfìefer, 1998).
Therefore, it was necessary to maintain all the trends and all the discontinuities of the terrain that were analysed and to interpret them on a case by case basis, excluding large structures that did not present problems of comprehension.
The working method used consequently the direct exploration of the point cloud and the aerial photographic data. Considering the presence of the infesting vegetation in some points of the plateau, the application of the procedure in Tarquinia allowed to conduct for the first time in Italy a specific research on the potentialities of that technology in similar conditions.
In order to obtain more information on the profiles of the terrain and the demonstration of the presence of archaeological remains hidden by the dense vegetation, an example could be represented by the northern area of the plateau where an additional flight was necessary. The obtained average density was about 10 points per square metre for the flat area of the “Pianoro della Civita”, increasing along the northern perimeter strip where the presence of the walls was expected. In this case a density of about 25 points per square metre has been reached, value that is not always homogeneous due to the physical-natural limit constituted by the presence of Mediterranean low, medium and high vegetation, particularly close to the ground points and sometimes difficult to distinguish from the background noise. For this reason, it was tried the recovery of the largest number of information along the outer layers of the plateau in order to improve, as much as possible, the details of the DTM/DSM and consequently make them more defined in view of their subsequent interpretation (Devereux et al., 2005; Doneus and Briese, 2011; Zaksek and Pfiefer, 2006).
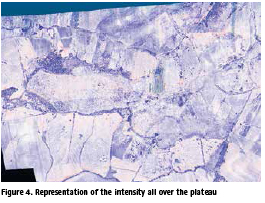
The elaborations were also based on analytical functions of the surfaces, for example: shading or hill-shading3 which have allowed to increase the shading effect in order to highlight the discontinuities; functions that allow to emphasize the altimetry to bring out the changes in altitude and better understand the course of the terrain; representations aimed at highlighting concavity and convexity of terrain and structures, using the Sky View Factor parameter4. Subsequent elaborations have taken into account the frequency and the number of returns of the pulses allowing to distinguish the different macro-categories (figure 4) that compose the cloud, thus allowing to exclude small, medium and high vegetation and to identify more clearly parts of the wall circuit and some archaeological structures (figure 5).

Above all, the insertion of an artificial lighting source within the three-dimensional model made it possible to better identify the discontinuities of the terrain, highlighting the contours even for the smallest changes of elevation. This process, together with the differentiation by macro-category of the points, has made easier a first identification of the areas and structures of possible interest from an archaeological point of view.
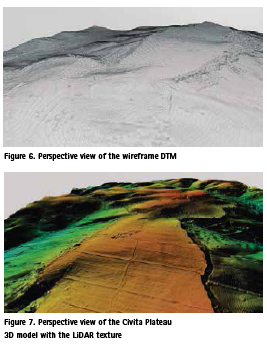
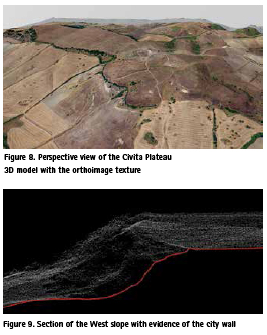
Through these different processes it was possible to obtain suitable explorations of the cloud, to determine the peculiar characteristics of the Civita Plateau and of the marks of continuity and to make the terrain clearly understandable, highlighting its morphology and the shapes it assumed (figures 6-8), returning the digital altimetric trend for an area of about 90 hectares.
This allowed to overcome the objective limit of the vegetation and to clearly identify signs and characteristics also thanks to dedicated tools, such as the sections (figure 9), able to show the morphology of the ground and its structures intercepted by the section plane.
In fact, the possibility of cutting the point cloud or the threedimensional model representing the trend of the terrain profile has made it possible to associate and verify data that have been uncertain until now. The sections have been also used to recognize small variations in height (15-20 centimetres) in specific areas that very often have been traced to structures present under a thin layer of earth (Marzullo and Piazzi 2017).
All these tools, representations and elaborations have been frequently used in combination in order to have a cross-checking. Subsequently these data were verified through on-site surveys, with acquisition of their positioning through GNSS instrumentation.
Main results
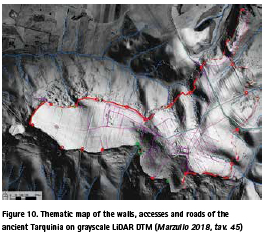
These analyses, together with what emerged from the interpretation of the cartographies and the archaeological research (Marzullo 2018, pp. 21-48), made it possible to evaluate and verify the remains, contributing to the creation of thematic maps of the Tarquinian ancient wall circuit (Marzullo 2018, pp. 79-93) (figure 10).
The comparative study of signs related to each cartographic threshold, carried out by inserting data into a Geographic Information System, highlighted the elements that constitute the palimpsest of the “Pianoro della Civita”, which can be both ancient and modern. In this regard, the systematic analysis of the historical documentation and of the thematic representations from the Renaissance to nowadays made it possible to understand which of these elements were ancient, while at the same time extending the basis of available information (Marzullo 2018, pp. 21-48).
The LiDAR data processing produced the most updated, accurate and comprehensive cartographic basis of the plateau. Thanks to its versatility, to the capability to isolate the different materials that compose the surfaces, to the possibility to exclude the vegetation, to measure the height and extension of the geomorphological evidence, and to observe all cartographic representation shaped according to the morphology of the territory, it was possible to rectify accurately all the cartographic information collected.
One of the most significant results is the assessment of structures and sites including several almost unknown remains. If the location and orientation of the remains could be generically indicated at the areal level, since they were only testified by archival documents such as sketches or excavation reports, the elaboration of the LIDAR data allowed a greater deepening.
Observing the morphological trend of the terrain in relation to the altimetry and examining the discontinuities, it emerged with immediate clarity the extraordinary correspondence between what was indicated in the documentation and the relative portion of the model with what is currently on the site.
Thus, evaluating the archival data in relation to the metrically reliable geometries of the three dimensional elaborations, it was possible to place with extreme precision not only limited portions, but whole areas.
If, on the one hand, this is a remarkable achievement itself because it had been impossible to observe so much information together in a single topographic view before, on the other hand, this is just the starting point for further researches.
One of these concerns an implementation of this open system, which now makes it possible to recover a set of fundamental information, such as the geophysical prospections carried out by the Fondazione Lerici between the 1960s and 1980s. The output of the prospections was not processed in a synthesis embracing the whole data. The past analyses were focused exclusively about road system, highlighting the anomalies in theory related to road alignments (Cavagnaro Vanoni, 1989).
The particular value of such achievements lies in the scope of the work, which is nowadays hard to replicate due to the exceptionality of the conditions of the plateau at that time, not yet polluted by waste and metal objects. The issues that have prevented experts from the use of prospections concern the amount of data, the difficulty of interpretation, and mainly their topographic positioning. In this regard, first of all, the Lerici system was set according to the magnetic North, which does not correspond to the geographic North. In addition, each square of the primary grid on the map corresponds to a predetermined linear length and does not consider the changes of the profiles of the terrain.
This means that the Lerici’s cornerstone mesh does not match to the corresponding physical limits of the same area on the maps. So, to recover the data, the alignment and positioning of the topographical mesh on the ground were needed, moulding it according to the current levels of the terrain. This is disadvantaged by the impossibility to recognize the topographical references used at those times to place the grid. Without such data, the only elements on which we can now rely are the immutable signs still identifiable in the territory, such as structures, and visible in the Lerici output.
The result we achieved is to newly anchor the geophysical information to the territory and numerous terms of reliable comparison for data analysis, essential tools to face the reconstruction of the urban dimensions of Tarquinia.
In this context, the above-mentioned integrated system of tools developed at interdisciplinary and multidisciplinary level provide a set of services for joining different existing data sources through the definition of a semantic network of relationships among landscapes, stratigraphic layers, structures and artefacts. Therefore, it allows to switch from a territorial scale to the scale of the structures and thereby facilitating the comparison between different series of evidence within the same site.
The set of cartographic, archival information and the recovery of data that couldn’t be considered in their wholeness up until now have allowed us to obtain an exhaustive cognitive framework, both from a strictly archaeological and topographic point of view. All this information, currently systematized and easily accessible through a database, is an invaluable resource also as regards as the management of the current territory of the “Pianoro della Civita di Tarquinia”. In fact, these data permits the design of plans, the drafting of guidelines for the preservation of the cultural landscape and of archaeological remains and allows a full involvement of the institutions operating on this territory through the creation of a common table with the aim of protection, conservation and enhancement of these areas. This system could be implemented and updated by different figures to store information, to keep track of the actions performed on the archaeological area, to evaluate the achieved results, to plan and to set the objectives regarding the next steps.
Endnotes
1Project coordinated at national level by G. Bartoloni and under the responsibility of G. Bagnasco Gianni for the section of Tarquinia MIUR – PRIN 2008-2012, Marzullo 2018
2The publication containing the archaeological interpretations and results on all the archaeological remains of the “Pianoro della Civita di Tarquinia” is currently in preparation, Marzullo 2018, pp. 18-19.
3Available in G.I.S. software such as ArcGIS or GlobalMapper.
4in SAGA G.I.S. open source software.
References
Bagnasco Gianni, G., 2012. Introduzione alla sezione tarquiniese. In: Aristonothos. Scritti per il Mediterraneo Antico. Il ruolo degli oppida e la difesa del territorio in Etruria: casi di studio e prospettive di ricerca, Vol. 5, Trento, Italy, pp. 19-21.
Bagnasco Gianni, G., Garzulino, A., Kay, S., Marzullo, M., Smith, C., 2018. Civita di Tarquinia. Magnetometric analisys of archaeological areas. In: Papers of the British School at Rome, Cambridge University Press, Cambridge, UK, pp. 328-332,
Barber, D.M., Dallas, R.W., Mills, J.P., 2006. Laser scanning for architectural conservation. In: Journal of Architectural Conservation, Vol. 12, pp. 35-52.
Bartoli, L.M., 2002. Conoscenza e rappresentazione, Firenze, Italy. Bertocci, S., Bini, M., 2012. Manuale di rilievo architettonico e urbano, Torino, Italy.
Bewley, R.H., Crutchley, S., Shell, C., 2005. New light on an ancient landscape: LiDAR survey in the Stonehenge World Heritage Site. In: Antiquity, Vol. 79 (305), pp. 636-647.
Bonghi Jovino, M., 2006. Progettualità e concettualità nel percorso storico di Tarquinia. In: Tarquinia e le civiltà del Mediterraneo, Atti del Convegno Internazionale (Milano 2004 – Quaderni di Acme), Vol. 77, Milano, Italy, pp. 401-415.
Bortolotto, S., Favino, P., Simonelli, R., 2013. Mura Tarquiniesi: lettura delle permanenze attraverso le foto aeree e la cartografia storica. In: Mura di legno, mura di terra, mura di pietra: fortificazioni nel Mediterraneo antico, Atti del Convegno Internazionale (Roma 2012), ScAnt Vol. 19.2-3, Roma, Italy, pp. 122-130.
Cavagnaro Vanoni, L., 1989. Intervento alla Civita di Tarquinia della Fondazione Lerici. In: Secondo Congresso Internazionale Etrusco (Firenze 26 maggio – 2 giugno 1985), Roma, Italy, pp. 341-345.
Cowley, D.C., Opitz, R.O., 2012. Interpreting Archaeological Topography. 3D Data, Visualisation and Observation, Oxford, UK. Crutchley, S., Crow, P., 2009. The light fantastic: Using airborne laser scanning in archaeological survey, London, UK.
De Laet, V., Paulissen, E., Meuleman, K., Waelkens, M., 2009. Effects of image characteristics on the identification and extraction of archaeological features from lkonos-2 and Quickbird-2 imagery: case study Sagalassos (southwest Turkey). In: International Journal of Remote Sensing, Vol. 30 (21), pp. 5655-5668.
Devereux, B.J., Amable, G.S., Crow, P., Cliff, A.D., 2005. The potential of airborne lidar for detection of archaeological features under woodland canopies. In: Antiquity, Vol. 79 (305), pp. 648-660.
Doneus, M., Briese, C., 2011. Airborne Laser Scanning in forested areas. Potential and limitations of an archaeological prospection technique. In: Remote Sensing for Archaeological Heritage Management, EAC Occasional Paper Vol. 5, Brussel, Belgium, pp. 59-76.
Garzulino, A., Perego A., Zerboni, A., 2013. Mura tarquiniesi: lettura delle evidenze (LiDAR) e degli aspetti geoarcheologici. In: Mura di legno, mura di terra, mura di pietra: fortificazioni nel Mediterraneo antico, Atti del Convegno Internazionale (Roma 2012), ScAnt Vol. 19.2-3, Roma, Italy, pp. 131-140.
Garzulino, A., 2019. LiDAR, territory and archaeological areas: new results and perspectives for the knowledge, analysis and preservation of complex context. In: ISPRS International Archives of Photogrammetry, Remote Sensing and Spatial Information Sciences, Vol. XLII- 2/W11, Göttingen, Germany, pp. 549-555.
Guidi, G., Remondino, F., Russo, M., Menna, F., Rizzi, A., Ercoli, S., 2009. A multi-resolution methodology for the 3D modeling of large and complex archaeological areas. In: International Journal of Architectural Computing, Vol. 7 (1), pp. 40-55.
Hencken, H., 1968. Tarquinia, Villanovans and early Etruscans, Londra, Peabody Museum of Harvard University, UK.
Kokalj, Z., Ostir, K., Zaksek, K., 2010. Archaeological Application of an Advanced Visualization Technique Based on Diffuse Illumination, EARSeL Symposium, Paris, France.
Kraus, K., Pfìefer, N., 1998. Determination of terrain models in wooded areas with airborne laser scanner data. In: ISPRS Journal of Photogrammetry and Remote Sensing, Vol. 53 (4), pp. 193-203.
Lerici, C.M., 1959. Prospezioni archeologiche a Tarquinia, Milano, Italy.
Marzullo, M., 2018. Tarquinia. L’abitato e le sue mura: indagini di topografia storica, Milano, Italy.
Marzullo, M., Piazzi C., 2017. Attività artigianali a Tarquinia: gli spazi, le strutture e i prodotti. In: Gli artigiani e la città. Officine e aree produttive tra VIII e III sec. a.C. nell’Italia centrale tirrenica, Atti della Giornata di Studio (British School at Rome, 11 gennaio 2016), ScAnt Vol. 23.2, 2017, Roma, Italy, pp. 255-272, 453.
Melis, F., Serra, F.R., 1968. La Via Aurelia da Civitavecchia al Marta. In: Quaderni dell’Istituto di topografia Antica della Università di Roma, La Via Aurelia da Roma a Forum Aurelii, Roma, Italy, pp. 89-105.
Remondino, F., Campana, S., 2014. 3D Recording and Modelling in Archeology and Cultural Heritage. Theory and best practices, BAR International Series 2598.
Remondino, F., 2011. Heritage Recording and 3D Modelling with Photogrammetry and 3D Scanning. In: Remote Sensing, Vol. 3, pp. 1104-1138.
Shan, J., Toth, C.K., 2009. Topographic Laser Ranging and Scanning, Boca Raton, USA.
Shaw, R., Corns, A., 2011. High Resolution LiDAR specifically for archaeology: are we fully exploiting this valuable resource?. In: Remote Sensing for Archaeological Heritage Management, EAC Occasional Paper Vol. 5, Brussel, Belgium, pp. 77-86.
Zaksek, K., Pfiefer, N., 2006. An improved morphological filter for selecting relief points from a lidar point cloud instep areas with dense vegetation (Technical report), Delft Institute of Earth Observation and Space systems, Delft, The Netherlands.


 (4 votes, average: 4.75 out of 5)


Leave your response!