| GIS - New | |
Space-based Precipitation Radar for Spatio-temporal Hydrology Analysis
This study informs the potential and opportunities of space-based precipitation radar to fill the gaps of knowledge on spatio-temporal rainfall patterns for hydrology and related fields in tropical region |
 |
|
 |
|
 |
|
 |
|
 |
|
Spatio-temporal rainfall changes at tropics had raised concern among scientists. However, comprehensive studies at catchment scale of Southeast Asia where the combined regional and local factor is a tough task to be carried out due to the inherent limitations of rainfall data sources especially in the remote, upper part and difficult access of the watershed. Often the hydrological analysis and reports informed less information [e.g. 1] regarding those areas which are getting more significant for the regional application. Therefore, an alternative support is strongly recommended to improve the spatio-temporal rainfall analysis and fill the gaps of knowledge in this watershed environmental niche.
The opportunities provided by the spacebased precipitation radar are significant to satisfy the raising issues. It provides temporal measurement, higher spatial gridded information, cost effective and convenient data inter-operability. There are increasing open source options for such information from wide range of satellites such as Tropical Rainfall Measuring Mission (TRMM), Meteosat, and GOSAT. Their potential to the local watershed application had been immensely studied by many researchers for the past decades [e.g., 2,3]. With the launch of the new Global Precipitation Mission in 2014, there is bright prospect of such rainfall measurement options to become one of the rainfall information sources at global scale. Nevertheless, comprehensive use of this kind of data at local Peninsular Malaysia especially in upper hilly watershed remains less explored.
There are two main issues addressed in this paper. First is the current spatio-temporal condition of rain gauge measurement in hilly catchment of Peninsular Malaysia, and second is to explore how the spacebased precipitation data could support to anticipate the sparse coverage and data inter-operability issues. In correspondence of both issues, two preliminary analyses were carried out. First, the spatial distribution and efficiency of rain gauge in hilly forested catchment of Peninsular Malaysia is evaluated with respect to the land use and elevation information using Geographical Information System (GIS) approach. Second, the spatial pattern of rainfall changes is analysed using the TRMM satellite information.
Materials and method
Study site description
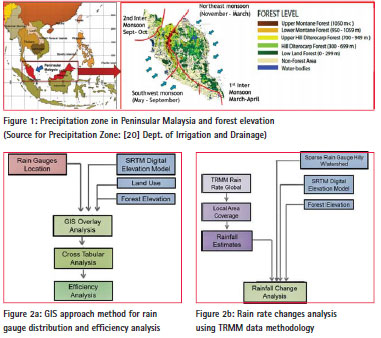
Peninsular Malaysia is located in Southeast Asia and experiences humid tropics climate through the year. The hilly and mountainous catchment in Peninsular Malaysia is highly dominated by dipterocarp and montane forest. The elevation ranged from 400m up to the highest peak of 2191m of Mount Tahan. The rainfall distribution pattern over Peninsular Malaysia is strongly influenced by the regional wind flows, and therefore, it is significant to describe them based on the seasonal monsoon flows [4]. Rainfall patterns experienced by Peninsular Malaysia are determined by two main monsoon seasons, the northeast monsoon (November to March) and southwest monsoon (May to September).
Orographic and convective rainfall types characterized the rainfall in hilly catchment through the year. From 1977 to 2001, Peninsular Malaysia produced about 580 cubic km of natural renewable water resources, where 97.6% were generated from surface water and only a small amount was generated from groundwater recharge (2.4%) [5]. The hilly catchment is pivotal for freshwater resources and also hydroelectric generation. Thus, there are about 20 reservoirs that resulted from the streamflow by hilly catchment areas. Figure 1 depicts the study area and its hydrological description.
Using GIS approach for rain gauge spatial distribution and efficiency analysis in hilly catchment
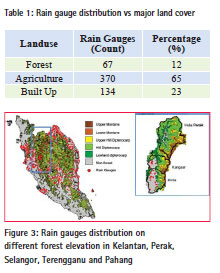
Major hilly and mountainous watershed areas in four states, namely Kelantan, Selangor, Perak, Pahang, and Terengganu were analysed, and 85% of hilly watershed is located in these four states. A total of 571 rain gauge information was collected from various sources, mainly Meteorological Department and Department of Irrigation and Drainage. The first step of this analysis is determining the spatial rain gauge distribution over the watershed areas by using land cover types and elevation. Elevation information is obtained from Shuttle Radar Topography Mission (SRTM) 90m grid resolution and the height is transferred to local datum. Cross tabular overlay analysis of rain gauge against the land use and forest elevation is implemented. The next step is to analyse the efficiency of the rain gauge which is located in the hilly catchment nearby area (~1.5km radius distance). Five indicators were then used to determine the efficiency of those rain gauges. Those indicators are; (i) Telemetry, (ii) Data logger, (iii) Automatic Operation, (iv) Ownership and (v) International Organization of Standardization (ISO) status. It is suggested that effective rain gauge should possess all those characteristics. The score of each indicator is then plotted using radar chart analysis. A perfect score of 50 indicates 100% efficiency of the rain gauge network system. Figure 2a shows the summary of the methodology flow.
Precipitation change analysis using space-based TRMM precipitation radar data
13 years of satellite observation period from 1998 to 2010 were acquired from the TRMM for this analysis. TRMM 3B43 Version 6 global data product is subset to the local area coverage and projected to the local projection and coordinate system. Then, the monthly rain rate was obtained and the annual basis co-efficient of variation (COV) was computed. Long term in-situ rainfall and evaporation records (>25 years) are also included for supporting the satellite analysis. Figure 2b illustrates the processing flow of the methodology.
Results
Rain gauge distribution spatial analysis against land use and elevation
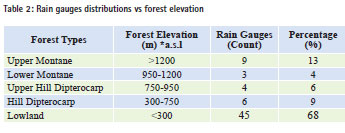
Table 1 presents the general classification of rain gauge distribution over major land cover in the four states. Based on the GIS spatial analysis, it showed that the proportion rain gauges located in the forested areas of the watershed were only 12% (Table 1). Further analysis indicates that apart from this 12% proportion, rain gauges coverage over higher elevation forest (300 – 1200m) experienced sparse distribution (Table 2). Spatial analysis also revealed that the hilly watershed in the west part of Peninsular Malaysia is more sparsely monitored compared to the east part. This is confirmed with a detailed view on three major hilly catchments in Kuala Kangsar, Hulu Perak and Kinta where most rain gauges were located in non-forested areas (Figure 3).
Rain gauge efficiency in hilly watershed areas
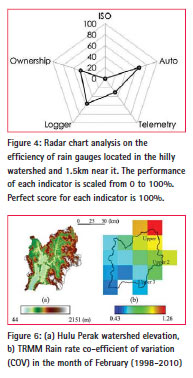
Figure 4 showed the radar chart analysis on the efficiency of the rain gauge, located in the hilly watershed areas and 1.5km from it. The figure illustrates imbalance scores in all indicators, especially the ISO standard. The overall performance of the rain gauge was only 40% (Table 3). Considering that one of the most critical criteria is the ability of the rain gauge to log and transmit data via telemetry, only 63% of the rain gauge distribution or 14 rain gauges is available to provide rainfall data effectively. This analysis indicates that effective assessment of hilly watershed is a challenging task due to intangible daunting conditions to obtain rainfall information.
From the results, it strongly suggests that there are gaps that must be fulfilled in rainfall measurement especially on the remote, thick and upper hilly areas and forested watershed. By referring to the recent evidence of the local rainfall spatial variations changes [6,7] it showed that the local hydrological patterns become more unpredictable and intensive studies is strongly needed. A space-based precipitation radar such as Tropical Rainfall Measuring Mission (TRMM) can be useful support systems in this situation, due to its advantages of cost effective operations and data handling complexity, which is suitable with the condition of the developing region which has limited resources and communication system efficiency.
Hilly watershed rain rate changes analysis
From the previous analysis, Hulu Perak watershed is one of the areas which had less rain gauge distribution as well as low rain gauge efficiency scores. The mountainous range reached 1500 m from mean sea level and 90 is covered by the tropical rainforest. It was one of a critical catchment in West Peninsular Malaysia and the main sources of streamflow for three major reservoirs which used to generate the hydroelectric turbines and other reservoirs for agricultural and freshwater resources. TRMM satellite data was used to analyse the rain rate which limited to be portrayed by rain gauge information.
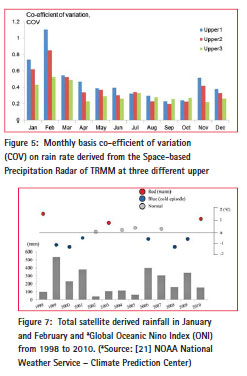
Monthly basis COV indicated that for the past 13 years significant rainfall pattern changes was identified in the months of January and February (Figure 5). Spatial pattern map showed that obvious changes occurred at the upper part of the watershed, with an elevation of more than 1000 meter and gradually lower towards the lower elevation (Figure 6). High amount of rainfall had occurred in two separate periods. First is 1999-2001 and the second is 2006- 2007. Since January and February are not the typical wet season of this region, there are possibilities that the changes may be due to the influence of external continental factors [8] or seasonal local monsoon shifting changes.
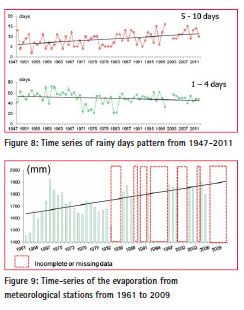
Further, analysis with the global Oceanic Nino Index (ONI) record from the Climate Prediction Center of the National Weather Service, US had indicated that the increased rainfall amount in January and February coincide with the high magnitude ocean cold due to La-Nina event in 1999, 2000, 2006 and 2008 (Figure 7). La Nina phenomena resulted in wet conditions in Southeast Asia [10] and in 1999 several other areas in the world were severely affected [11]. On the other hand, significant evidence of local climate change also had been detected through the individual rain gauge analysis term of increased of longer rainy days (Figure 8) and increased evaporation (Figure 9).
Discussion
There are three main issues discussed:
I) The spatial rain gauge analysis obtained in this study suggest that appropriate utilization of various spatial data and satellite precipitation information in GIS environment can effectively support the hilly watershed productivity assessment. The rain gauge spatial distribution and efficiency reports could be distributed to the local authority or responsible agencies concerned with related matters. Significant measures can be immediately taken and improvement of the existing water management system can be conducted precisely. Eventually, a successful integration of spatial and geoinformation science into sustainable practice of hilly watershed hydrology in this country faced great challenges in terms of human resources capacity as well as substantial financial resources. It was recommended that a sustainable and practical framework should be created that adept in reaching the success attained by the developed countries such as Japan (AMEDAS system), Australia and others.
II) Studying the output of hilly watershed rainfall changes, this study also confirmed that the extent of the impact of climate change on a local scale has increased their variations at spatial location and time. For record, there are growing trends of frequent water induced disasters reported over the past 15 years [e.g. 12, 13]. One of the most recent disaster was a flood that resulted due to extreme heavy rainfall in hilly watershed areas. One of the areas is Cameron Highlands, a hilly area of Malaysia [14], and the second is the lowland high urban settlement areas of Ipoh [15]. Thus, the ability of satellite-based precipitation to provide valuable information, since rain gauge measurement was limited, provided opportunities to realize the effective climate change and natural hazards planning, mitigation and assessment.
III) Successful utilization of space-based precipitation radar which set for global scale basis measurement at local scale environment requires intensive validation and calibration efforts. Even though the preliminary assessment of TRMM rain rate data in Peninsular Malaysia suggests positive correlation with discreet rain gauge [16], however its actual accuracy when converted into rainfall estimates are remained unexplored. Moreover, the rainfall intensity, pattern and seasonality in this region are highly dynamic [6, 7]. A direct use of space-based precipitation radar data into hydrology models revealed that uncertainties vary within geographical conditions and latitudes [9, 17, 18, 19].
Conclusion
The current status of rain gauge distribution spatial analysis in major hilly watershed in Peninsular Malaysia, and the potential of space-based precipitation radar have been presented in this study. The spatial analysis revealed that the rain gauge distribution had sparse coverage on hilly watershed and possessed inadequate efficiency for effective spatial based monitoring. The second analysis indicates that there are significant monthly rainfall changes on the upper part of the hilly watershed for the last 13 years which occurred occasionally in different years of 1999, 2000, 2001, 2006 and 2009. This phenomenon can be associated with the cold temperature of La-Nina. The study informed the potential and opportunities of space-based precipitation radar to fill the gaps of knowledge on spatio-temporal rainfall behavior for hydrology and related fields.
Acknowledgement
We would like to thank everyone who directly or non-directly involved in this study. High appreciation is devoted to the data provider, Malaysian Meteorological Department, Department of Irrigation and Drainage, National Space Administration (NASA) and Institute of Industrial Science, University of Tokyo.
References
[1] Monthly abstract of Meteorological Observations, July, 1999, Malaysia Meteorological Service.
[2] Su, F., Hong, Y. and Lettenmaier, D. P. (2007). Evaluation of TRMM Multisatellite Precipitation Analysis (TMPA) and Its Utility in Hydrologic Prediction in the La Plata Basin, 9(4), 622-640. J. Hydrometeorology. Vol. 9, doi: 10.1175/2007JHM944.1.
[3] Shrestha, M. S., Artan, G. A., Bajracharya, S. R., and Sharma, R. R. (2008). Using Satellite-Based Rainfall Estimates for Streamflow Modelling: Bagmati Basin. J. Flood Risk Management. Volume 1, Issue 2: 89-99.
[4] Wong, C. L., Venneker, R., Uhlenbrook, S., Jamil, A. B. M. and Zhou,Y. (2009). Variability of Rainfall in Peninsular Malaysia. Hydrol. Earth Syst. Sci. Discuss. 6: 5471-5503.
[5] FAO (2005). Freshwater Resources. Population Division of the Department of Economic and Social Affairs of the United Nations Secretariat, World Bank.
[6] Diong Jeong Yik, Subramaniam Moten, Munirah Ariffin and Siva Shangari Govindan. (2010). Trends in Intensity and Frequency of Precipitation Extremes in Malaysia from 1951 to 2009, Technical Reports, Malaysia Meteorological Department.
[7] Jamaludin Suhaila, Abd Aziz Jemain (2012). Spatial Analysis of Daily Rainfall Intensity and Concentration Index in Peninsular Malaysia. Theoretical Application Climatology. 108: 235-245.
[8] Fredolin T. Tangang, Liew Juneng, Ester Salimun, Kwan Meng Sei, Loh Juile and Halimatun Muhamad. (2012), Climate Change and Variability over Malaysia: Gaps in Science and Research Information, Sains Malaysiana 41 (11) : 1355-1366.
[9] Mahmud M.R. & Hashim M. (2010). Determination of Forest Water Yield in Malaysian Tropical Watershed using Calibrated Satellite-based Rainfall Data, IEEE Int. CSSR 2010, Kuala Lumpur, Malaysia.
[10] National Space Administration (NASA) Earth Observatory Official Website. The Effects of La Nina. http://earthobservatory.nasa.gov./ Features/LaNina/la_nina_2.php
[11] Michael H. Glantz. (2002). La Nina and Its Impacts: Facts and Speculation. United Nations University Press.
[12] Dept. of Irrigation and Drainage. (2007a). District of Muar and Batu Pahat, Introduction of Flood Hazard Mapping. Dept. of Irrigation and Drainage Malaysia Special Report.
[13] Dept. of Irrigation and Drainage. (2007b). Laporan Taklimat Banjir Segamat, 2006/2007. Dept. of Irrigation and Drainage Malaysia Special Report.
[14] New Straits Times Online Press (2013). Audrey Dermawan. Mud Flood Kills 3, One Missing in Cameron Highlands. 23 October 2013.
[15] New Straits Times Online Press (2013). Roshidi Abu Samah. 1151 victims in Perak. 23 October 2013
[16] Varikoden, H., Samah, A. A., and Babu, C. A. (2010). Spatial and Temporal Characteristics of Rain Intensity in the Peninsular Malaysia Using TRMM Rain Rate. J. Hydrology. 387:312-319. doi:10.1016/j.jhydrol.2010.04.023.
[17] Nishat, B. and Rahman, S. M. (2009). Water Resources Modeling of the Ganges-Brahmaputra-Meghna River Basins using Satellite Remote Sensing Data. JAWRA Journal of the American Water Resources Association. 45: 1313–1327.
[18] Tobin, K. J., and Bennett, M. E. (2008a). Using SWAT to Model Streamflow in Two River Basins with Ground and Satellite Precipitation Data. J. American Water Resources Association. Volume 45: Issue 1, 253-271.
[19] M. Rizaludin Mahmud, and M. Hashim. (2012). Operational Satellite- Based Watershed Monitoring Systems (SAWMOS) for Large Humid Tropical Catchment Environment. 2011 IEEE Colloqium on Humanities, Science and Engineering (CHUSER).
[20] Dept. of Irrigation and Drainage Malaysia. (1989). Average Annual and Surface Water Resources of Peninsular Malaysia. No.12, Water Resources Publication.
[21] NOAA Climate Prediction Center (2013). Historical El Nino/ La Nina episodes (1950-present). Online information. http://www.cpc.ncep.noaa. gov/products/analysis_monitoring/ ensostuff/ensoyears.shtml


 (2 votes, average: 4.50 out of 5)


Leave your response!