| My News | |
Planning model for multiple hazard prone towns
This paper presents a planning model for hazard prone towns based on earthquake and flood damage assessment. |
|
Due to natural disasters like earthquake and flood the whole world suffers great losses; some towns vanish at one go and for all others it takes years and decades to resume the same state. To protect the existence of such hazard prone towns and minimize the losses it is important that planners frame some guidelines for the proper development of these towns which should be included in the master plan of these towns. For development of these towns a planning model based upon earthquake and flood damage assessment has been developed which can be utilized for other similar towns of the world.
Methodology
Following methodology has been utilized to achieve the above mentioned research objectives:

Case study
Earthquake and Flood Vulnerability of Madhya Pradesh
Madhya Pradesh which lies in the heart of India suffers mainly from two major hazards, namely floods and earthquakes. All earthquake activity is confined to Narmada-Son fault zone which runs across the State. The Earthquake Hazard Map of Madhya Pradesh with highlighted high-risk zone is shown in (Figure 2).

Hoshangabad is one of the towns, which comes very close to this high-risk zone. It is situated very close to two faults and hence close to a cross fault. The town is a district headquarter situated on the banks of the river Narmada. It is not only prone to earthquake but also flood. Geotechnically the town is settled on thick alluvium which is a very thick layer of sand mixed with clay and silt- which is not very compact and quite loose. This may increase the damage during minor earthquakes also. The other towns which come in this high risk zone are Jabalpur, Khandwa etc. Major institutions of the country like Geological survey of India, are working in this field. But for Hoshangabad town no study has been conducted till now.
Disaster history in the study area
The Hoshangabad town ship is very close to the active SONATA fault, which is the root cause for seismic activities in the region. The area falls under seismic zone III, which comes under moderate seismic risk region. The region has experienced 7 earthquakes in last 150 years, among which two had magnitude more than 6.
Flood is a frequent phenomenon in the study area. In last 80 years, more than 76 times, flood had inundated the lowlying area (Figure 3).

Floods in the study area are due to Narmada River and its tributaries. Data of last 80 years show that every year flooding is there up to certain extent but at least once in 10 years extreme flooding takes place.
Data collection
For detail analysis, 33 wards of the township which come under Municipal Corporation have been taken for study. The land use land cover of the city has been studied. The Municipal area covers 15,537 houses. To collect precise information about building stock distribution, a sample survey was conducted. In this regard, 5% buildings were surveyed and distribution was projected on the remaining building stock. The questionnaire developed for surveying the houses includes detailed information about material used for roof, wall and foundation, economic condition of house owner, configuration of buildings etc. The distribution of categories of houses in 33 wards of town has been taken as distribution shown in Census report 2002. The scenario has been developed only on building stock excluding other infrastructure. The Census of India 2001 has provided housing stock of the study area with special emphasis on type of material used in wall, floor and roofs.
Damage assessment criteria
The scenario has been developed on the basis of The Medvedev Sponheuer-Karnik (MSK) Scale of Intensity. Further the categorization is improvised using the Vulnerability Atlas of India. These are:
1. A Type Adobe, Field stonemasonry, Unburnt brick walls.
2. B Type Burnt Brick Houses.
3. C Type RCC and framed structure.
4. X Type Others (Light building material GI sheet, Asbestos sheets).
Earthquake damage scenario
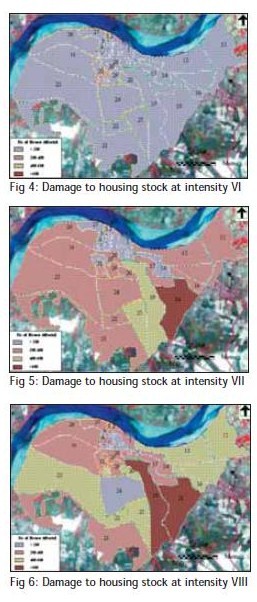
Based on experiences of past earthquakes, It is observed that A and B types are prone to damage at lower scale of intensity. The Hoshangabad town has 33 wards with population 97357. Based on the damage assessment criteria, survey results and 2001 census, damage Assessment at Intensity VI, VII & VIII for Hoshangabad Township has been calculated. At varying intensities the damage of total building stock is as given in Table 1.

At varying intensities the damage in different wards can be seen in Figure 4, Figure 5 and Figure 6.

As per the Earthquake Scenario, damage to houses may extend up to 73%. In view of such colossal damage, it is necessary to take immediate steps for earthquake safety of the area.
Flood damage scenario
The damage Scenario changes with flood water levels. The increasing trend of damage is based directly on the increasing intensity of floodwater, which increases with flood levels. Looking at the historical flood levels recorded at Sethani Ghat, Hoshangabad of past 80 years, damage scenario for three most probable flood levels have been worked out with the help of survey results and flooding as observed through the years. At varying flood levels the areas which will be affected is as given in Table 2.

The various flood inundation areas at different flood levels have been represented in Figure 7, Figure 8 and Figure 9 respectively.

At varying flood levels the damage of Housing stock is as given in Table 3. The scenario has been developed only on housing stock excluding other infrastructure.

The approximate population likely to be affected at different flood levels are presented below in Table 4.

Pages: 1 2


 (1 votes, average: 2.00 out of 5)


Leave your response!