
| Imaging | |
Mapping the urban atmospheric carbon stock
Readers may recall that we have published the first part of this paper in April 2022 issue of Coordinates where material and methods were discussed. Here we present the concluding part |
|
|
|
|
|
3. Results
3.1. GEOBIA Classification Results and Validation
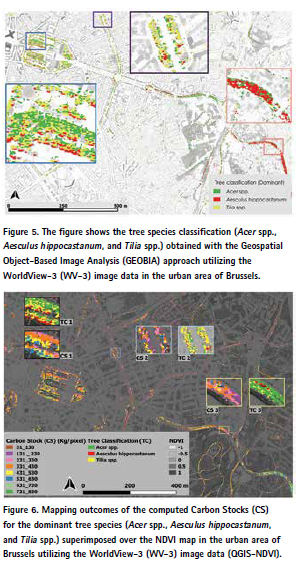
As the WV-3 image was from the early spring, trees having dead leaves/ branches made it relatively harder to identify the species in Brussels. Thus, species detection was difficult due to the spectral similarities and understory issues. However, the classified map shows that most of the streets are covered with the Acer spp. and Tilia spp., while the other species, Aesculus hippocastanum has been primarily observed in the southern part of the city (Figure 5).
The producer and user accuracy were around 70% for Tilia spp. and Aesculus hippocastanum, and around 80% to 100% were for the Acer spp. during the confusion matrix estimation (Table 2). Indeed, it was quite essential to define the effectiveness of the GEOBIA approach and to show the percentage of error.
3.2. CS Mapping and Validation
3.2.1. CS Mapping in Brussels with WV-3 Image Data
The computed CS for the dominant species has been mapped showing the quantity of CS based on the species in different zones (Figure 6). As far as most of the trees were on the streets, the canopies were not overlapped by the wider crowns. Except for some plots having trees almost leafless or trimmed canopies, the computed CS values based on NDVI derived variables were significant (Figure 6) for most of the dominant species.
Figure 6. Mapping outcomes of the computed Carbon Stocks (CS) for the dominant tree species (Acer spp., Aesculus hippocastanum, and Tilia spp.) superimposed over the NDVI map in the urban area of Brussels utilizing the WorldView-3 (WV- 3) image data (QGIS-NDVI). In Figure 6, all three-square boxes (as in CS1, CS2, and CS3) are showing moderate (i.e., pink, orange, yellow, and blue coloured zones) to a higher quantity of CS for each of the species (as in TC1, TC2, and TC3). These three zones were zoomed-in considering those plots having comparatively dense canopies, as the WV-3 image was acquired in early spring, most of the plots were with lighter crowns or leaves.
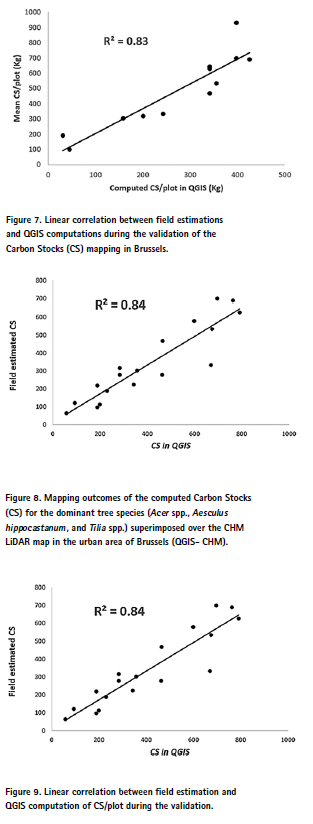
In Table 3, the validation results show that the field estimation and QGIS computed CS values have apparent variations in few cases. These kinds of differences between the field estimated and the computed values were quite natural in the case of this study. The field data were collected in the summer of 2019, while the WV-3 image was acquired in the early spring of 2017. QGIS computation was done based on the NDVI (WV-3 data) extracted values where most of the trees were leafless or less green. As a result, in the case of few plots, NDVI values were lower, which indeed showed lower CS values during the mapping. In addition, the year gap between the field data (2019) and the WV-3 data (2017) also significantly impacted the CS mapping outcomes, since trees in urban areas usually go through the management practices (i.e., trimming, pruning, etc.) [146], which is also responsible for the larger variations among the field and QGIS computed values (Table 3). For instance, out of the 20 validation plots, only three plots (plot no. 4, 11, and 18) are showing noticeably more CS/plot than those of the field estimations. Trees in those plots are assumed to be a subject of trimming and or other management practices, explaining the reasons for having lower AGB or CS/plot in 2019 than those of 2017 for those three plots. A regression analysis had been done to understand the significance of the mapping approach.
It was quite noticeable that in most cases where the tree canopies were comparatively evident, even in the early spring season, the percentage of agreement (Figure 7) was more than 80% (R2 = 0.83). Except for a few cases, this CS mapping approach could be applied in CS mapping, even in a complex urban environment.
3.2.2. CS Mapping in Brussels with LiDAR Data
Figure 8 shows that the computed CS map in QGIS was quite relevant in LiDAR data for all the identified dominant species TC1, TC2, and TC3 in Figure 8). Even the LiDAR data was from 2015, each of the three dominant species had shown evident outcomes in CS mapping (CS1, CS2, and CS3 in Figure 8) based on the field data of 2019. As the LiDAR data (from summer 2015) and field data were acquired in summer, the AGB productions per plots were significant to predict the CS during the mapping based on the CHM- derived variables in QGIS.
For the CS mapping validation, the validation plots were the same ones as earlier in the case of WV-3 image data. The outcomes of the validation plots did not show that much difference between the field estimated and QGIS computed values (Table 4). Only a few plots were showing higher differences in the quantity of computed CS, which was assumed to be a result of tree crown management practices (i.e., trimming, pruning, etc.) [146]. Out of all 20 plots, only a few plots (i.e., plot no. 2, 9, 14, 15, and 17) were showing noticeable variations between the field and QGIS estimations (Table 4). While in most of the plots, trees were showing lower differences in the case of the total atmospheric CS considering the on-plot calibrated values.
A regression analysis was done to understand the relevance of the applied CS mapping approach. It was noticed that the R2 was significantly higher (84%), for most of the plots (Figure 9). As shown earlier (Section 3.2.1), the data acquisition period (2015 and 2019) and the certain tree crown management practices (i.e., Trimming, pruning, etc.) [146] have also been found responsible for having larger variations in a few cases. As a result of regular crown trimming practices, the trees, even with a wider trunk, were showing smaller crowns in CHM during the CS computation in QGIS.
4. Discussion
4.1. GEOBIA Classification and Urban Trees
WV-3 image data were utilized to classify three dominant tree species applying the GEOBIA approach in the case of a heterogeneous urban area like as Brussels. The Overall Accuracy (OA) of the species classification was around 71%, considering all the identified urban tree species (Table 2). The classification accuracy could be improved (around 90%) by applying the data fusion (i.e., LiDAR and hyperspectral) approach or estimating OA considering the general urban land cover classification [147–153]. Since this study’s primary goal was to identify and classify only the dominant tree species for further CS mapping in QGIS, we show the OA only referring to the trees class and not for the other land cover classes such as roads, grasslands, and pavements. Unfortunately, studies on urban tree species or genera-based classification (only with multispectral data) with better accuracy (more than 70%) are hardly available unless the study area is quite smaller (i.e., [154–156]).
Recently, Fang et al. [157] have done the tree genera-based classification (from WV-3 data) with an OA of 62 to 74% for a larger urban area in Washington D.C., USA. Considering a study area covering almost 49 km2, this study in Brussels also could be a good example for approving the efficacy of the GEOBIA approach. The accuracy level was different for each species, where the higher was for the Acer spp. (89%) and the lower one was found for the Aesculus hippocastanum (64%). Initially, the segmentation and later the relevant samples for training the NN algorithm significantly influenced the OA of the classification outcomes, as shown in previous studies [36,158]. Training samples must be sufficient considering each species/class, which will be enough for the algorithm to verify different classes. In this study, the samples had been selected to train the NN algorithm covering the whole study area in Brussels. However, the different species’ spectral characteristics made it quite challenging to distinguish due to their unique phenological ages or conditions [147,159]. In some cases, misinterpretations of desired classes had been identified, recognizing the “mixed pixel issues” where some pixels were not solely covered by one homogeneous class [147,160]. Consequently, with an OA of 71%, this study does show that the WV-3 data could be more convenient, especially in urban areas, as the WV-3 image has an increased level of radiometric, geometric, and spatial (8 bands) resolution leading to classify urban trees at the species level [147,161].
Even remote sensing-based technologies are far better acceptable, the potential barriers to adopting remote sensing techniques include but are not limited to the level of specialist knowledge, the data collection time, instruments type and parameters for the acquisitions, etc. For instance, the classification OA could minimize such issues as the image registration error, the spectral and spatial resolution limitations, and overlapping spectral signature of the classes. These facts could be considered to initiate further research to improve and utilize the GEOBIA approach to achieve a species-level classification with higher accuracy, especially for the urban trees.
4.2. CS Mapping Approach: A Comparative Analysis
In this study, the mapping approach has been found far more convincing than that of the existing traditional approaches (i.e., approaches excluding remote sensing tools). The traditional biomass assessment methods are mostly based on field measurements which are not so convenient or practical to conduct over large areas considering a broadscale assessment [8,162]. Considering the dominant species, the CS mapping outcomes in Brussels were quite explicit and feasible, where the assessment was highly influenced by the seasonal variations between the data sources (field and remote sensing data). However, no such factors or issues could hardly be sorted out to improve the mapping outcomes in both cases. For instance, it is evident that in Brussels, the CS mapping outcomes could be more significant having both data sources (i.e., field and remote sensing data) from the same season or year. The CS computation utilizing the LiDAR data could be a good example since there was not much variation with the field estimations (Table 4). However, in all cases, there were other noticeable issues such as the narrow or too wide and/ or small overlapped crowns, trimmed crowns, and so on other management practices. These issues are obvious to be considered precisely for any urban landscapes [7,63,64] that are heterogeneous in space, structurally, and functionally [44,163–165]. However, the proposed remote sensing-based methodology could be availed as more essential and applicable in the case of monitoring and mapping vegetation ecosystems and their services than that of the traditional ones.
To date, it is critical to developing a high-resolution map of tree biomass within the context of carbon monitoring over terrestrial ecosystems to assess the ecosystem response to climate change [166–171], which increases the utilization of RS-based technologies for the last few decades. For instance, LiDAR data are widely being used to complete highresolution surveys of vegetation structure over forested areas and cities [53,172–175] and estimate biomass and carbon storage in urban vegetation [26,53,176,177] due to its im-proved accuracy. Even though it is believed that the application of RS is quite expensive in vegetation mapping, Jones et al. (2010) [33,178] found automated methods from combined hyperspectral and LiDAR data (approximately USD 6 per ha) to be competitive against traditional aerial photograph interpretation (approximately USD 12 per ha) in terms of accuracy and cost for a study area in South-western Canada. However, the availability of LiDAR data is not always cost-effective, especially for developing countries. For those cases where LiDAR data are hardly available, high-resolution image data could be a solution for the city policymakers. For instance, studies show that high-resolution commercial data (Rapid Eye, IKONOS, Geo-eye) are available with an approximate cost of 1–14 € per km2, which is still more affordable than the LiDAR data (USD 62–240 per km2) [179,180]. Ac-cording to Hummel et al., the approximate cost of aerial LiDAR data acquisition for an area of almost 128 km2 (31,614 acres) was around USD 40,500, excluding the processing costs (additional USD 33,424) [181]. While the WV-3 image data covering an area of 128 km2 could be around USD 2500 (USD 19 km−2), considering the best possible buying options for archive imagery [182]. This could be an appropriate example of LiDAR data’s application of almost 15 to 20 times higher than that of the WV-3 image data. Therefore, it could be a better initiative to imply other data sources, especially in developing countries, where it is impossible to integrate or have an available LiDAR data source. Considering the cost-efficiency and the research perspectives, this study has been conducted to identify the best outcomes in each case (LiDAR and WV-3 image data) and understand the result discrepancies among similar study areas. However, it is also clear that the mapping out-comes utilizing LiDAR data were more impressive (Table 4) than that of the WV3 data. Nevertheless, the regression analysis still showed a significant level of acceptance (Figure 7) for the WV-3 image outcomes in Brussels. On the other hand, the percentage of LiDAR data outcomes except for only a few plots was more than 80% (Figure 9).
Moreover, city planners and managers usually plan to rely on a few urban tree at-tributes i.e., urban forest structure, green cover, species composition and diversity, available planting spaces, and tree condition to make short- and longterm decisions about the urban forest resource [15]. However, at the same time, the costs associated with data collection and monitoring (such as remote sensing applications) have to be compensated by reducing field measurement expenses or increasing management efficiency that leads to increased income based on improved decision-making [33]. Therefore the utilization and application of the advanced remote sensing technology depend on the purpose, economic feasibility, and the prospects of the resulted outcomes. Nevertheless, the proper understanding of the urban tree species contributions in atmospheric carbon sequestration and storage is one the most pertinent issues for urban green planning and management [183,184].
5. Conclusions
This mapping approach could be an efficient tool in CS mapping that will assist urban planners in ensuring proper utilization of the available green spaces considering other valuable prospects of tree species mapping in a complex city environment. This study will also recognize the prospects of the applied approach based on an efficient GEOBIA classification method for urban tree species mapping. For instance, this study shows that the OA of tree species classification could be hugely influenced by the trees’ positions, crown structures, and spectral attributes, where the resulting outcomes were useful for further CS mapping in Brussels. The CS mapping approach reveals that the tree stands level and temporal variations of the data acquisition period might significantly impact the total atmospheric CS for each species in urban areas. This study highlights that accurate tree CS mapping is crucial for estimating and identifying the dominant species contributing a significant level of atmospheric CS, which could be an efficient support for the urban planners and environmental policymakers in planning further urban air quality assessments. It also illustrates the facts considering the convenience and suitability of utilizing LiDAR and WV3 image data, especially in the case of vegetation mapping along with their functional attributes. This study could assist future research in either case of tree classification or mapping ecosystem services, having a significant prospect on remote sensing applications in the case of heterogeneous urban areas. Especially for the developing countries or where the application of LiDAR data is not that cost-effective, this mapping approach will show the alters with WV-3 image data. Soon another study will be introduced to compare the CS mapping outcomes between the WV-3 data and the Sentinel 3 data in the case of urban trees.
This study will contribute to a better understanding of the methodology in mapping structural and functional properties, such as tree CS, as well as predicting the possible urban CS in typical city areas. It might be a way out for the policymakers in mapping tree species as well as their probable ecological significance in urban areas over the traditional methods. Thus, the researchers and city planners could go forward to employ and implement the advanced ways of CS mapping for the typical urban areas assessing the possible prospects of the approach against the unavoidable impacts of climate change.
Author Contributions: Conceptualization, M.A.M.C., A.G. and E.M.; methodology, M.A.M.C..; software, M.A.M.C. and G.M.; validation, M.A.M.C.; formal analysis, M.A.M.C., A.G., G.M. and E.M.; investigation, M.A.M.C., A.G., G.M. and E.M.; resources, M.A.M.C., A.G., E.M., B.S. and G.M.; data curation, M.A.M.C. and G.M.; writing— original draft preparation, M.A.M.C., A.G. and E.M.; writing—review and editing, M.A.M.C., A.G., E.M., B.S. and G.M.; supervision, A.G. and E.M. All authors have read and agreed to the published version of the manuscript. Funding: This research received no external funding.
Conflicts of Interest: The authors declare no conflict of interest.
References
146. Jacobs. Annual Report. 2018. Available online: https://www.jacobs. com/sites/default/files/files/2018-12/ Jacobs-2018-Annual-Report.pdf (accessed on 24 May 2021).
147. Jombo, S.; Adam, E.; Byrne, M.J.; Newete, S.W. Evaluating the capability of Worldview-2 imagery for mapping alien tree species in a heterogeneous urban environment. Cogent Soc. Sci. 2020, 6, 1754146. [CrossRef]
148. Lumnitz, S.; Devisscher, T.; Mayaud, J.R.; Radic, V.; Coops, N.C.; Griess, V.C. Mapping trees along urban street networks with deep learning and street-level imagery. ISPRS J. Photogramm. Remote Sens. 2021, 175, 144–157. [CrossRef]
149. Wang, M.; Liu, R.; Lu, X.; Ren, H.; Chen, M.; Yu, J. The use of mobile lidar data and Gaofen-2 image to classify roadside trees. Meas. Sci. Technol. 2020, 31, 125005. [CrossRef]
150. He, S.; Du, H.; Zhou, G.; Li, X.; Mao, F.; Zhu, D.; Xu, Y.; Zhang, M.; Huang, Z.; Liu, H.; et al. Intelligent Mapping of Urban Forests from High-Resolution Remotely Sensed Imagery Using Object-Based U-Net- DenseNet-Coupled Network. Remote Sens. 2020, 12, 3928. [CrossRef]
151. Rasti, B.; Ghamisi, P.; Gloaguen, R. Fusion of Multispectral LiDAR and Hyperspectral Imagery. In Proceedings of the IGARSS 2020—2020 IEEE International Geoscience and Remote Sensing Symposium; Institute of Electrical and Electronics Engineers (IEEE), Online, 24 February 2020; pp. 2659–2662.
152. Zhang, Y.; Shao, Z. Assessing of Urban Vegetation Biomass in Combination with LiDAR and High-resolution Remote Sensing Images. Int. J. Remote Sens. 2021, 42, 964–985. [CrossRef]
153. Hansch, R.; Hellwich, O. Fusion of Multispectral LiDAR, Hyperspectral, and RGB Data for Urban Land Cover Classification. IEEE Geosci. Remote Sens. Lett. 2021, 18, 366–370. [CrossRef]
154. Li, D.; Ke, Y.; Gong, H.; Li, X. Object-Based Urban Tree Species Classification Using Bi-Temporal WorldView-2 and WorldView-3 Images. Remote Sens. 2015, 7, 16917–16937. [CrossRef]
155. Nölke, N. Continuous Urban Tree Cover Mapping from Landsat Imagery in Bengaluru, India. Forests 2021, 12, 220. [CrossRef]
156. Mustafa, Y.; Habeeb, H.N.; Stein, A.; Sulaiman, F.Y. Identification and mapping of tree species in urban areas using worldview-2 imagery. ISPRS Ann. Photogramm. Remote Sens. Spat. Inf. Sci. 2015, II-2/W2, 175–181. [CrossRef
157. Fang, F.; McNeil, B.E.; Warner, T.A.; Maxwell, A.E.; Dahle, G.A.; Eutsler, E.; Li, J. Discriminating tree species at different taxonomic levels using multi-temporal WorldView-3 imagery in Washington D.C., USA. Remote Sens. Environ. 2020, 246, 111811. [CrossRef]
158. Laliberte, A.S.; Koppa, J.; Fredrickson, E.L.; Rango, A. Comparison of Nearest Neighbor and Rule-based Decision Tree Classification in an Object-oriented Environment. In Proceedings of the 2006 IEEE International Symposium on Geoscience and Remote Sensing, Denver, CO, USA, 31 July–4 August 2006; pp. 3923–3926.
159. Le Louarn, M.; Clergeau, P.; Briche, E.; Deschamps-Cottin, M. “Kill Two Birds with One Stone”: Urban Tree Species Classification Using Bi- Temporal Pléiades Images to Study Nesting Preferences of an Invasive Bird. Remote Sens. 2017, 9, 916. [CrossRef]
160. Salih, A.A.; Ganawa, E.- T.; Elmahl, A.A. Spectral mixture analysis (SMA) and change vector analysis (CVA) methods for monitoring and mapping land degradation/ desertification in arid and semiarid areas (Sudan), using Landsat imagery. Egypt. J. Remote Sens. Space Sci. 2017, 20, S21–S29. [CrossRef]
161. Waser, L.T.; Küchler, M.; Jütte, K.; Stampfer, T. Evaluating the Potential of WorldView-2 Data to Classify Tree Species and Different Levels of Ash Mortality. Remote Sens. 2014, 6, 4515–4545. [CrossRef]
162. Kumar, L.; Mutanga, O. Remote Sensing of Above-Ground Biomass. Remote Sens. 2017, 9, 935. [CrossRef]
163. Zhou, W.; Cadenasso, M.L.; Schwarz, K.; Pickett, S.T. Quantifying Spatial Heterogeneity in Urban Landscapes: Integrating Visual Interpretation and Object- Based Classification. Remote Sens. 2014, 6, 3369–3386. [CrossRef]
164. Cadenasso, M.L.; Pickett, S.T.; McGrath, B.; Marshall, V. Ecological Heterogeneity in Urban Ecosystems: Reconceptualized Land Cover Models as a Bridge to Urban Design; Springer Science and Business Media LLC: Cham, Switzerland, 2013; pp. 107–129.
165. Band, L.E. Heterogeneity in Urban Ecosystems: Patterns and Process, Ecosystem Function in Heterogeneous Landscapes; Springer: New York, NY, USA, 2005; pp. 257–278.
166. Houghton, R.A.; House, J.I.; Pongratz, J.; Van Der Werf, G.R.; DeFries, R.S.; Hansen, M.C.; Le Quéré, C.; Ramankutty, N. Carbon emissions from land use and landcover change. Biogeosciences 2012, 9, 5125–5142. [CrossRef]
167. Oughton, R.A.H. Aboveground Forest Biomass and the Global Carbon Balance. Glob. Chang. Biol. 2005, 11, 945–958. [CrossRef]
168. Hurtt, G.; Zhao, M.; Sahajpal, R.; Armstrong, A.; Birdsey, R.; Campbell, E.; Dolan, K.A.; Dubayah, R.; Fisk, J.P.; Flanagan, S.; et al. Beyond MRV: High-resolution forest carbon modeling for climate mitigation planning over Maryland, USA. Environ. Res. Lett. 2019, 14, 045013. [CrossRef]
169. Hurtt, G.C.; Fisk, J.; Thomas, R.Q.; Dubayah, R.; Moorcroft, P.R.; Shugart, H.H. Linking models and data on vegetation structure. J. Geophys. Res. Space Phys. 2010, 115. [CrossRef]
170. Gu, H.; Williams, C.A.; Ghimire, B.; Zhao, F.; Huang, C. High-resolution mapping of time since disturbance and forest carbon flux from remote sensing and inventory data to assess harvest, fire, and beetle disturbance legacies in the Pacific Northwest. Biogeosciences 2016, 13, 6321–6337. [CrossRef]
171. Huang, W.; Dolan, K.A.; Swatantran, A.; Johnson, K.D.; Tang, H.; O’Neil-Dunne, J.; Dubayah, R.; Hurtt, G. High-resolution mapping of aboveground biomass for forest carbon monitoring system in the Tri-State region of Maryland, Pennsylvania and Delaware, USA. Environ. Res. Lett. 2019, 14, 095002. [CrossRef]
172. Varhola, A.; Coops, N. Estimation of watershed-level distributed forest structure metrics relevant to hydrologic modeling using LiDAR and Landsat. J. Hydrol. 2013, 487, 70–86. [CrossRef]
173. Simonson, W.D.; Allen, H.D.; Coomes, D.A. Applications of airborne lidar for the assessment of animal species diversity. Methods Ecol. Evol. 2014, 5, 719–729. [CrossRef]
174. Goodwin, N.R.; Coops, N.C.; Tooke, T.R.; Christen, A.; Voogt, J. Characterizing urban surface cover and structure with airborne lidar technology. Can. J. Remote Sens. 2009, 35, 297–309. [CrossRef]
175. Alonzo, M.; Bookhagen, B.; McFadden, J.P.; Sun, A.; Roberts, D.A. Mapping urban forest leaf area index with airborne lidar using penetration metrics and allometry. Remote Sens. Environ. 2015, 162, 141–153. [CrossRef]
176. Shrestha, R.; Wynne, R.H. Estimating Biophysical Parameters of Individual Trees in an Urban Environment Using Small Footprint Discrete-Return Imaging Lidar. Remote Sens. 2012, 4, 484–508. [CrossRef]
177. Raciti, S.M.; Hutyra, L.R.; Newell, J.D. Mapping carbon storage in urban trees with multisource remote sensing data: Relationships between biomass, land use, and demographics in Boston neighborhoods. Sci. Total. Environ. 2014, 500-501, 72–83.[CrossRef]
178. Jones, T.G.; Coops, N.C.; Sharma, T. Assessing the utility of airborne hyperspectral and LiDAR data for species distribution mapping in the coastal Pacific Northwest, Canada. Remote Sens. Environ. 2010, 114, 2841–2852. [CrossRef]
179. Wang, K.; Wang, T.; Liu, X. A review: Individual tree species classification using integrated airborne LiDAR and optical imagery with a focus on the urban environment. Forests 2019, 10, 1. [CrossRef]
180. Ørka, H.O.; Hauglin, M. Use of Remote Sensing for Mapping of Non-Native Conifer Species. INA fagapport 33. 76p. 2016. Available online: http://www.umb.no/statisk/ ina/publikasjoner/fagrapport/if33. pdf (accessed on 24 May 2021).
181. Hummel, S.; Hudak, A.T.; Uebler, E.H.; Falkowski, M.J.; Megown, K.A. A Comparison of Accuracy and Cost of LiDAR versus Stand Exam Data for Landscape Management on the Malheur National Forest. J. For. 2011, 109, 267–273. [CrossRef]
182. LAND INFO Worldwide Mapping, L. Satellite Imagery Pricing— Satellite Imagery Solutions & Digital Map Data—LAND INFO Worldwide Mapping. Available online: https:// landinfo.com/satellite-imagerypricing/ (accessed on 18 May 2021).
183. Green Structure and Urban Planning—Final Report. Available online: https://www.cost. eu/publications/green-structureand- urban-planning-final-report/ (accessed on 17 August 2020).
184. Sturiale, L.; Scuderi, A. The Role of Green Infrastructures in Urban Planning for Climate Change Adaptation. Climate 2019, 7, 119.[CrossRef]
Copyright: © 2021 by the authors. Licensee MDPI, Basel, Switzerland. This article is an open access article distributed under the terms and conditions of the Creative Commons Attribution (CC BY) license (https:// creativecommons.org/licenses/by/ 4.0/)
The paper originally published in Forests 2021, 12,692. https://doi. org/10.3390/ f12060692 has been republished wth authors’ permission.
NASA, Partners develop ‘Lunar Backpack’ technology
Imagine a mountaineering expedition in a wholly uncharted environment, where the hikers had the ability to generate a real-time 3D map of the terrain. NASA researchers and their industry partners have developed a remote-sensing mapping system set to aid explorers in the most isolated wilderness imaginable: the airless wastes at the South Pole of the Moon.
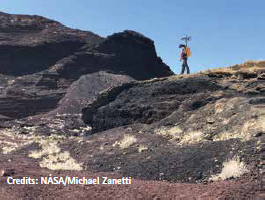
The Kinematic Navigation and Cartography Knapsack (KNaCK) is a mobile lidar scanner – a remote sensing method that uses light detection and ranging laser light to measure range. Donned like a hiker’s backpack, it makes use of an innovative type of lidar called frequency modulated continuous wave (FMCW) lidar in order to provide Doppler velocity and range for millions of measurement points per second. These measurement points instantly create a real-time navigation system, delivering to the explorer a 3D “point cloud” or highresolution map of the surrounding terrain.
Think of it as a superpowered version of laser range finders used by surveyors or the highly sensitive proximity alarms that help smart cars avoid collisions, said planetary scientist Dr. Michael Zanetti, who leads the KNaCK project at NASA’s Marshall Space Flight Center in Huntsville, Alabama.
“Basically, the sensor is a surveying tool for both navigation and science mapping, able to create ultra-high-resolution 3D maps at centimeter-level precision and give them a rich scientific context,” Zanetti said. “It also will help ensure the safety of astronauts and rover vehicles in a GPS-denied environment such as the Moon, identifying actual distances to faroff landmarks and showing explorers in real time how far they’ve come and how far is left to go to reach their destination.”
That’s a key challenge as Artemis-era explorers prepare to undertake the first modern missions to the Moon, and the first ever to its South Pole. The Sun never rises more than 3 degrees above the lunar horizon there, leaving much of the terrain in deep shadow. That makes distances to various points of interest difficult to eyeball.
Initiated in 2020 with funding by NASA’s Early Career Initiative, the KNaCK project has partnered with Torch Technologies Inc. of Huntsville to develop the backpack prototype and associated navigation algorithms that permit accurate mapping without GPS.
Using KNaCK during rover excursions and when traveling on foot, explorers could precisely map the topography of the landscape, including deep ravines, mountains, and caves. Lidar even works in pitch blackness, relieving astronauts of the need to haul cumbersome lighting rigs everywhere they go. Next, the KNaCK team will work to miniaturize the hardware – the backpack prototype weighs about 40 pounds – and harden the sensitive electronics against the punishing effects of microgravity and solar radiation.
Molly Porter
Marshall Space Flight Center, Huntsville, Alabama nasa.gov


 (No Ratings Yet)


Leave your response!