
| Applications | |
Landslide vulnerability mapping for Himachal Pradesh
We present a detailed landslide vulnerability map developed on the Google Earth Engine (GEE) platform using a Weighted Overlay Model. |
 |
|
 |
|
Abstract
This study addresses the escalating threat of landslides in Himachal Pradesh, exacerbated by a combination of a fragile Himalayan ecosystem, a heavy monsoon climate, and unplanned human development. The devastating 2025 monsoon season, which resulted in over 360 fatalities and crores in economic losses, underscores the urgent need for effective risk mitigation. We present a detailed landslide vulnerability map developed on the Google Earth Engine (GEE) platform using a Weighted Overlay Model. The methodology integrates nine key parameters, including rainfall intensity, slope, land use change (particularly implemented through forest loss during 2000-2020), and proximity to roads apart from others, with each factor assigned a weight based on its contribution to landslide risk. Our analysis highlights that the mid-hills, where a mix of steep terrain and human settlements exists, are the most vulnerable. Specific high-risk zones were identified in districts such as Kullu, Mandi, Shimla, Chamba and Kinnaur. The resulting map serves as a vital tool for informing policy decisions and enhancing disaster preparedness. The paper concludes by emphasizing the critical need for sustainable development and resilient planning to safeguard Himachal Pradesh’s fragile landscape from future catastrophes.
Note: The analysis presented here is the sole responsibility of the authors and does not reflect the views of their respective organizations. The findings are based on secondary data and are intended as an academic exercise.
1. Introduction
Landslides are a pervasive natural hazard in the Himalayan state of Himachal Pradesh, a region characterized by its young geology, tectonic activity, and a heavy monsoon climate. To effectively manage and mitigate the risks posed by these events, it’s crucial to identify and map areas of high susceptibility. This paper uses an advanced geospatial approach on the Google Earth Engine (GEE) platform to create a detailed landslide vulnerability map. By combining and analysing multiple environmental and anthropogenic factors, the model produces a comprehensive vulnerability index that can help to make informed policy decisions and disaster preparedness strategies.
2. Landslides in Himachal Pradesh (2025)
Himachal Pradesh has faced one of its most devastating monsoon seasons in recent years, with landslides, flash floods, and cloudbursts wreaking havoc across the hill state. As of early September 2025, the official toll of rain-related disasters has risen to more than 200 deaths, while total fatalities, including those from road accidents triggered by adverse conditions, have crossed 360. Hundreds more have sustained injuries, and thousands of families have been displaced.
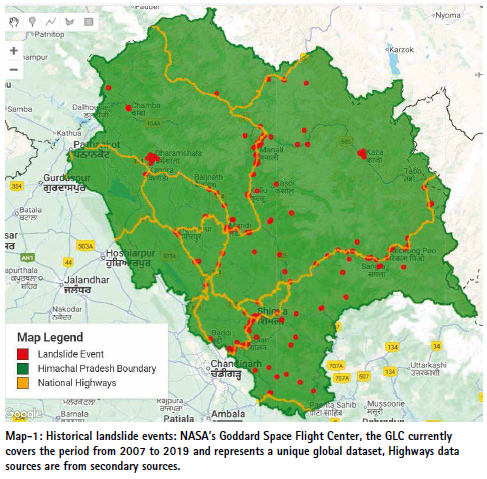
Himachal Pradesh has a long history of recurring landslides, occurring almost every monsoon season. One scientific record of these events is the Global Landslide Catalog (GLC), developed by NASA’s Goddard Space Flight Center. The GLC systematically documents rainfall triggered landslide events worldwide, regardless of their size, location, or impact, drawing on sources such as media reports, disaster databases, scientific studies, and other reliable records. Compiled since 2007 and covering the period from 2007 to 2019, the dataset provides a unique global baseline of landslide occurrences. Analysis of the data demonstrates that a significant number of landslides in Himachal Pradesh occur along major highways and transport corridors, highlighting the vulnerability of critical infrastructure to rainfall-induced hazards.
The destruction to infrastructure and property has been staggering. Official estimates of economic losses range between Rs 1,900 crore and over Rs 3,000 crore. Entire stretches of road networks have been washed away, leaving hundreds of villages cut off from essential supplies. At the peak of the monsoon fury, close to 300 roads, including national highways, were blocked due to landslides. Power supply was disrupted at several locations, with over 300 transformers damaged, while more than 250 water supply schemes were rendered inoperative.
Private property has also been severely affected. Nearly 4,000 houses have either collapsed or suffered major structural damage, while many more stand partially damaged and unsafe for habitation. Alongside, over 25,000 head of livestock have perished, compounding the economic pain for rural households dependent on agriculture and dairying. Shops, cowsheds, bridges, ghats, and irrigation systems have also been swept away.
The state’s water and irrigation infrastructure has been among the worst hit. Out of more than 10,000 water supply and irrigation schemes, around 7,500 suffered damages, leading to losses of over Rs 580 crore. While authorities have managed to temporarily restore nearly 95% of drinking water schemes, many remain fragile and vulnerable to further collapse.
Excessive rainfall — nearly 72% above normal in some regions — has intensified the crisis. Cloudbursts and sudden heavy downpours have triggered flash floods, particularly in districts like Kullu, Mandi, Kangra, and Shimla. Tragically, many of the fatalities have occurred at night when landslides buried homes, leaving families with little chance of survival. The Kullu disaster in September, where f ive members of a single family were killed as their home was destroyed, highlighted the vulnerability of settlements built along unstable slopes.
The impact has not been limited to rural and remote regions. Towns and semi-urban areas have also seen extensive damages, with traffic disruptions, water shortages, and repeated power cuts. Tourism, a vital sector for the state’s economy, has also suffered due to the closure of major routes like the Chandigarh-Manali highway.
The widespread damage has underscored the fragility of Himachal Pradesh’s ecology in the face of unplanned development and changing rainfall patterns. Experts warn that intense rainfall, coupled with indiscriminate hill cutting, deforestation, and unscientific construction, is steadily increasing the frequency and severity of landslides. The 2025 monsoon season has therefore not only left behind a trail of destruction but also a stark reminder of the urgent need for sustainable development and disaster-resilient planning in the fragile Himalayan ecosystem.
3. Driving cause
Experts have repeatedly warned that the scale of destruction cannot be attributed to rainfall alone. The driving causes lie in a dangerous mix of natural fragility and human intervention. The intensity of rainfall has increased sharply in recent years even as its duration has shortened, producing sudden cloudbursts and extreme downpours that the slopes cannot absorb. Compounding this is extensive hill-slope cutting for roads, tunnels, hydropower projects, and unregulated construction across the fragile mountains. Blasting for infrastructure, widespread deforestation, and exploitative land-use practices have further destabilized the landscape, making it more prone to catastrophic failures during intense rainfall, as highlighted by reports in The Hindu, Hindustan Times, The Economic Times, and India Today.
4. Hazard Mapping & Regional Vulnerability
Forty-nine per cent of Himachal Pradesh is prone to medium-risk and 40% to high risk landslides, floods and avalanches, according to a recent study by the Indian Institute of Technology (IIT)- Ropar.
4.1 Geographical risk breakdown:
• Upper reaches (high altitudes): prone to avalanches, especially Kinnaur and Lahaul-Spiti. • Middle & lower zones: more vulnerable to landslides and floods— notably in Kangra, Kullu, Mandi, Una, Hamirpur, Bilaspur, and Chamba.
• Steeper slopes (16.8°–41.5°) at higher altitude are hotspots for multiple hazards, while moderate slopes (5.9°–16.4°) up to 1,600 m combine f lood and landslide susceptibility.
5. Methodology
The core of this project is a Weighted Overlay Model, a common technique in geospatial analysis for multi criteria decision-making. The process involves four main steps:
1. Parameter Selection: We identified a set of key factors scientifically known to influence landslides. These included both static (e.g., topography) and dynamic (e.g., rainfall, land use change) variables.
2. Data Acquisition and Processing: Using GEE’s extensive data catalog, we accessed and processed publicly available datasets. For each factor, we derived a raster layer representing its influence on landslide risk.
3. Normalization: To make the layers comparable, each was normalized to a scale from 0 to 1. This step ensures that a factor’s original unit of measurement (e.g., meters, affect the final result.
4. Weighted Summation: Each normalized layer was assigned a weight reflecting its relative importance in landslide causation in the Himalayan context. The final vulnerability index for any given location is the sum of all weighted parameters. The formula is as follows:
Vulnerability=∑i=1n (Wi ×Pi )
Where:
▪ Vulnerability is the final vulnerability score.
▪ Wi is the assigned weight for parameter i.
▪ Pi is the normalized value of parameter i.
5. Weighted Overlay: This is the central calculation step. The vulnerability image is created by multiplying each normalized layer by a predefined weight and then adding them all together.
6. The weights reflect the relative importance of each factor. For instance, rainfall and slope are given higher weights (0.20 and 0.15) because they are typically major drivers of landslides, while aspect and drainage proximity are given lower weights (0.05).
7. The formula is: Vulnerability = (Slope×0.15)+(Aspect×0.05) +(Curvature×0.05) +(Rainfall×0.20)+(NDVI×0.10) +(LandUseChange×0.15) +(Dist. Roads×0.15)+(TWI×0.15)+(Dist. Drainage×0.05)
6. Parameters and Justification
The following parameters were selected and justified based on their role in slope stability and landslide occurrence.
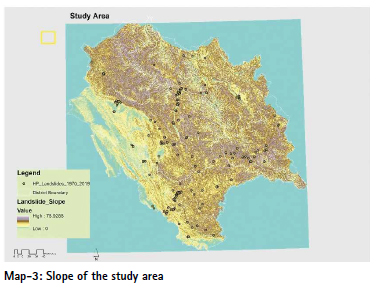
1. Slope: The most fundamental parameter. Steep slopes increase the gravitational force acting on the soil mass, making them inherently more unstable. A higher slope angle directly correlates with increased landslide risk.
▪ Data Source: USGS SRTM Digital Elevation Model (DEM). This global dataset provides high resolution elevation data necessary for precise slope calculations.
▪ Justification: A weight of 0.15 was assigned, recognizing that slope is a primary driver of mass movement.
2. Rainfall Intensity: Prolonged or intense rainfall saturates soil and bedrock, increasing pore water pressure and significantly reducing the soil’s shear strength. This is a major triggering factor for landslides in the monsoon-dominated climate of Himachal Pradesh.
▪ Data Source: CHIRPS (Climate Hazards Group InfraRed Precipitation with Station data). This dataset provides long-term daily rainfall averages, capturing the region’s precipitation patterns.
▪ Justification: With a weight of 0.20, rainfall is considered the most significant contributing factor.
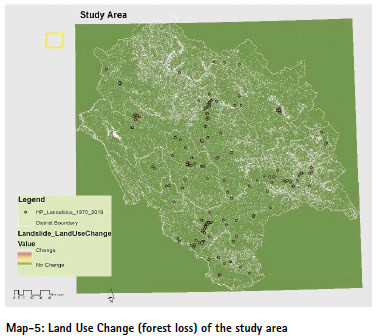
3. Land Use Change: Human activities like deforestation, construction, and agricultural expansion alter natural drainage patterns and destabilize slopes by removing vegetation cover.
▪ Data Source: ESA WorldCover. By comparing the 2020 and 2021 versions of this global land cover dataset, we created a binary layer identifying areas where land use has changed, indicating recent human intervention. Both years provide 10-meter resolution global land cover maps, developed by ESA in collaboration with Wageningen University and supported by Copernicus.
▪ Justification: A weight of 0.15 reflects the significant role of human activity in triggering landslides.
4. Proximity to Roads: Road construction in mountainous terrain often involves slope cutting and excavation, which removes toe support and disrupts the natural stability of the hill.
▪
Data Source: OpenStreetMap. This dataset provides a detailed road network from which we computed the distance of any given point to the nearest road.
▪ Justification: With a weight of 0.15, this factor is highly influential, as a vast majority of landslides are triggered by human infrastructure development.
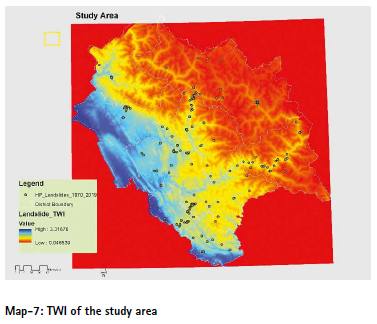
5. Topographic Wetness Index (TWI): TWI is an indicator of soil moisture accumulation. High TWI values point to areas where water naturally converges, making the ground oversaturated and vulnerable to failure.
▪ Data Source: Derived from the USGS SRTM DEM.
▪ Justification: A weight of 0.15 was given, as water accumulation is a key condition for slope failure, independent of direct rainfall.
6. Vegetation (NDVI): Vegetation cover, measured by the Normalized Difference Vegetation Index (NDVI), plays a protective role. Plant roots act as a natural binder for soil, enhancing its stability and preventing erosion. Areas with less vegetation are more exposed.
▪ Data Source: MODIS/ MOD13Q1 Vegetation Index.
▪ Justification: A weight of 0.10 acknowledges the protective but less direct role of vegetation compared to triggers like rainfall.
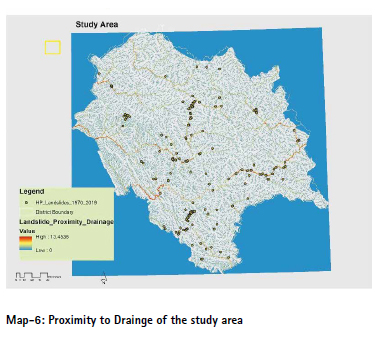
7. Proximity to Drainage: Areas near rivers and streams are susceptible to bank erosion and water-induced saturation, which can undercut slopes and cause instability. ▪ Data Source: MERIT Hydro. This dataset provides high-resolution global hydrography data.
▪ Justification: A weight of 0.05 was assigned, as this is a localized factor, but still contributes to risk.
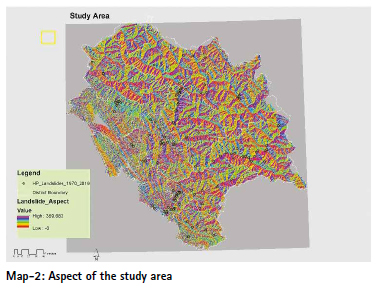
8. Aspect: The direction of a slope influences its exposure to sun, wind, and rainfall. This can affect soil moisture and the type of vegetation present. For example, sun-facing slopes may be drier, while slopes exposed to prevailing winds and rain can be more saturated.
▪ Data Source: Derived from the USGS SRTM DEM.
▪ Justification: A small weight of 0.05 was given as its influence is more indirect and location specific compared to other factors.
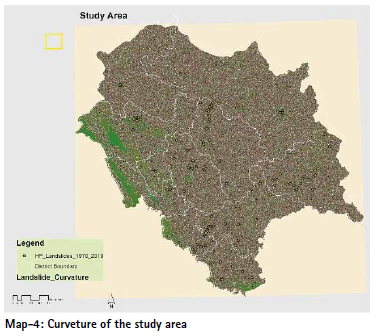
9. Curvature: The shape of the slope, whether it’s convex (outward curving) or concave (inward-curving), affects water flow and accumulation. Concave areas tend to concentrate water, increasing infiltration and risk.
▪ Data Source: Derived from the USGS SRTM DEM.
▪ Justification: A weight of 0.05 reflects its subtle but important role in local hydrology.
Classification into Zones: The f inal vulnerability image, with pixel values ranging from 0 to 1, is then reclassified into five distinct zones:
• Low: Score < 0.2
• Moderate: 0.4 ≤ Score < 0.6
• High: 0.6 ≤ Score < 0.8
• Very High: Score ≥ 0.8
7. The Foundational Role of Forests
Beyond their ability to make slopes more resistant to movement and erosion, forests play a crucial hydrological role. They function as natural sponges, absorbing and transpiring water from the soil, which significantly reduces the overall water content on a slope. In contrast, excessively saturated soil becomes heavy and unstable, dramatically increasing the likelihood of a landslide. By mitigating water infiltration, forests serve as a vital buffer against the very force that makes soil unstable.
Forest degradation, which includes outright deforestation for activities such as agriculture and urban development, directly undermines these protective functions. When a forest is cleared, the soil loses its natural anchor, leaving the ground loose, exposed, and highly vulnerable to being dislodged, particularly during intense monsoons. This connection between forest loss and landslides is especially pronounced in high-rainfall areas like the Himalayas, where the removal of tree cover allows rain to directly hit the ground, accelerating surface erosion and increasing the volume of water infiltrating the soil. This rapid rise in soil saturation can quickly lead to a slope’s catastrophic failure.
The relationship between landslides and forest degradation can create a destructive feedback loop. While human-induced degradation can trigger a landslide, a major landslide event can, in turn, destroy vast tracts of forest. The immense force of the slide removes topsoil and vegetation, further reducing the landscape’s ability to recover and making it even more susceptible to future disasters.
7.1 The Case of Himachal Pradesh
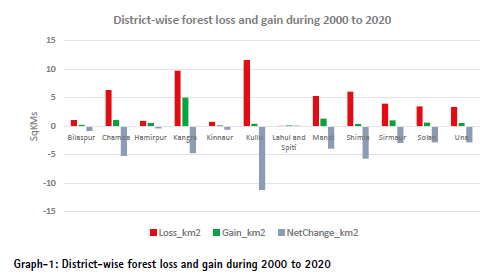
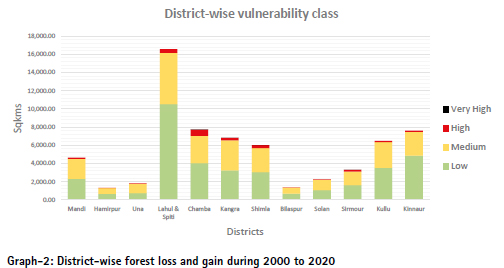
The data on forest cover in Himachal Pradesh serves as a tangible example of this challenge. As of the year 2000, the state’s forested area was approximately 15,485 km². Over the subsequent two decades (2001–2020), Himachal Pradesh experienced a net forest loss of 75.3 km². While some areas saw gains through reforestation or natural regeneration, the loss of 91.4 km² outweighed these gains, resulting in a measurable reduction in forest cover. This decline represents a critical weakening of the region’s natural defenses against landslides, placing both the natural environment and human communities in greater peril.
The data for forest changes in Himachal Pradesh comes from Global Forest Watch (GFW). GFW is a platform that tracks global forest change using satellite data. The core of their analysis is the Hansen et al. Global Forest Change dataset, which was created by a collaboration between the University of Maryland and Google using imagery from the Landsat satellite program.
8. Results and Limitations
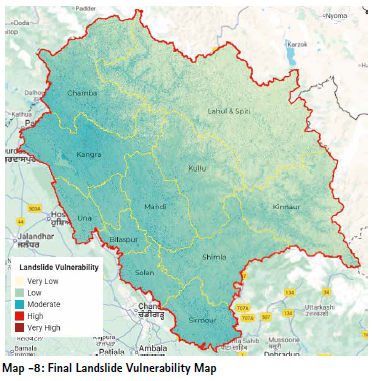
The final vulnerability map provides a continuous index ranging from 0 (very low vulnerability) to 1 (very high vulnerability). The results highlight that the most vulnerable zones are concentrated in the mid-hills, where a combination of steep terrain, high rainfall, and dense human settlements overlap.
• Kullu District → High & Very High vulnerability in Beas Valley slopes, along NH-3 (Aut–Manali stretch), Banjar and Ani sub-divisions.
• Mandi District → High risk along Pandoh–Jogindernagar highway, Balh valley slopes.
• Shimla District → Vulnerability around Rampur–Narkanda road corridor, Shimla–Chopal belt.
• Chamba District → High risk in Bharmour and Churah regions.
• Kinnaur District → Very High risk in Sangla valley, Reckong Peo–Powari zone.
9. Limitations:
• Model Assumptions: The weighted overlay model assumes that the selected weights are static and universally applicable across the entire study area, which may not hold true for all micro climates and geological settings.
• Data Resolution: The 500-meter resolution of some datasets may not capture small-scale vulnerabilities.
• Exclusion of Factors: The current model doesn’t incorporate crucial geological factors like lithology, fault lines, or seismic data, which are fundamental to understanding slope failure in the Himalayas.
10. Scope for Further Improvement
Future iterations of this project could significantly enhance accuracy and utility. Incorporating geological maps, historical landslide inventories, and seismic hazard data would provide a more complete picture of susceptibility. Using advanced machine learning models (e.g., Random Forest, Gradient Boosted Trees) could allow for a more data-driven determination of parameter weights, potentially identifying non linear relationships between factors. Additionally, creating a near-real-time monitoring system that integrates recent satellite imagery and rainfall data could provide short-term landslide warnings.
11. Bibliography/References
• USGS. SRTM Digital Elevation Model.
• Climate Hazards Group. CHIRPS Daily Precipitation.
• European Space Agency. WorldCover.
• NASA. MODIS/MOD13Q1 Vegetation Index.
• Yamazaki, D. et al. (2019). MERIT Hydro: A high-resolution global hydrography map. Water Resources Research.


 (No Ratings Yet)


Leave your response!