| GNSS | |
Geodynamical study of the territory of Balkan peninsula
The territory of the Balkan Peninsula (BP) is one of the most active geodynamical regions in Europe. Numbers of publications are devoted to this problem. An important indicator in geodynamical point of view is an eventual station movement of GNSS network stations. Determination of the size and direction of the vectors of movement, their analysis and assessment is of significant importance for their further interpretation with a view to present the geodynamical picture of the region. The purpose of the present study is a complete analysis and generalization of the behaviour of GNSS permanent stations on the territory of the Balkan Peninsula in all four seasons. This is the final step of the study of the seasonal movements of GNSS BP permanent stations. The investigated period covers the time span from 2006 till 2010. GPS one week data from free available GNSS permanent stations on the territory of the Balkans have been used in each season within each year. Station velocity vectors have been estimated from combined solutions for every season with Bernese software, Version 5.0. The estimated seasonal horizontal velocity vectors have been compared and analyzed. They have been also compared with results from other investigations. Seasonal solutionsThe geodynamic investigations have been accomplished by using GPS data from all free available GNSS permanent stations on the territory of the Balkan Peninsula within the time between 2006 and 2010. The stations are equipped with different types of receivers and antennas and for some of them the receiver or antenna have been changed within the period of the investigation. Location of the Balkan Peninsula permanent stations is shown in Figure 1. The number of Balkan Peninsula permanent stations increased during this period of five years from 6 in 2006 up to 29 in 2010.
Data from the same weeks of the respective season of the involved years have been used by the reason of comparability. The same general input parameters have been introduced in data processing of all weekly solutions and possibly almost the same IGS stations have been included for datum definition in all combined solutions. Station velocity vectors have been estimated in ITRF2005 from combined solutions of the particular four seasonal solutions. Winter solution GPS weekly data in January from four years – 2006, 2007, 2008 and 2009 of 18 GNSS stations have been processed. Estimations of station velocities have been obtained and analysis and comparison of the results has been accomplished [Vassileva, 2009b]. The obtained IRF2005 estimations of the velocity vectors are consistent with the IRF2005/EPN/CEGRN long-term velocity estimations within 1-2 mm/yr in all three components VX, VY, VZ. ETRF horizontal velocity vectors have been also obtained by using ETRF components of the Eurasia plate rotation pole to the obtained ITRF velocity vectors [Boucher, Altamimi, 2008].
Spring solutionGPS weekly data in April from four years – 2006, 2007, 2008 and 2009 of 21 GNSS stations have been processed and analyzed [Vassileva, 2010]. The spring velocity estimations obtained from all four years combined solution have been compared with the results from IRF2005/EPN/CEGRN long-term annual solutions. Comparison of the velocity estimations of the Balkan Peninsula stations shows differences within 0,1÷2,5 mm/yr with some exceptions. Higher discrepancies for some stations can be explained with shorter observation time span (only two years) and also with number of equipment alterations and subsequent offsets. ETRF horizontal velocity vectors of the stations have been also obtained (Figure 3).
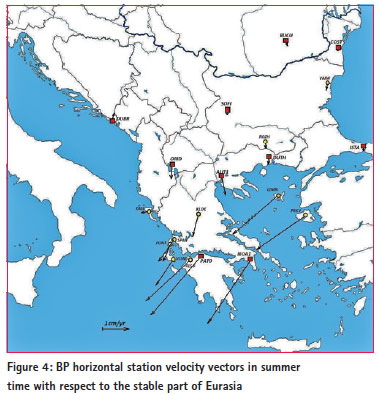
Summer solutionGPS one week data in July of 29 GNSS stations on the territory of the Balkans have been used. They cover a time span within five years – 2006, 2007, 2008, 2009 and 2010. Individual year solutions have been combined and station velocity estimations have been obtained. Results have been compared and analyzed [Vassileva, 2011]. All possible three and four years combinations and total five years solution of the obtained weekly solutions in 2006, 2007, 2008, 2009 and 2010 have been processed and station velocity estimations have been obtained in the system ITF2005. Velocity estimations in North and East components of all combinations show very good agreement. In Up component discrepancies are about 2 mm/yr and they can be considered mostly as impact of local phenomena. Only for stations LEMN, PRKV and VLSM differences are higher although their results are from four years. ETRF horizontal velocity vectors have been also obtained (Figure 4).
After analyzing the results from all combinations as most reliable velocity estimations have been accepted the estimations obtained from all five years observations. The obtained velocity estimations agree very well with results from other investigations [Stangl et al., 2008], [Caporali et al., 2009, 2011], [Hefti, Igondova, 2009], [Becker et al, 2010]. Autumn solutionGPS one week data in October of GNSS stations on the territory of the Balkans have been used. They cover a time span within five years – from 2006 up to 2010. The total number of participated stations increased from 20 in 2006 up to 40 in 2010 including IGS/EPN stations. Eight Balkan Peninsula stations participated only in one year – BURG, DRAG, LOVE, MONT, NIS_, SHUM, STAR, YUND as they are very yang stations, which started operating in 2009. Seven stations – DUTH, KUST, NVRK, PAZA, PAT0, SAND and SOFA participated only in two years. All possible three and four years combinations and total five years solution of the obtained weekly solutions in 2006, 2007, 2008, 2009 and 2010 have been processed and station velocity estimations have been obtained in the system ITF2005. Results have been compared and analyzed [Vassileva, 2012].
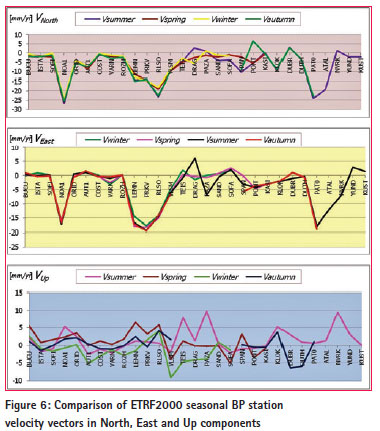
The reduced horizontal velocities of the Balkan Peninsula stations to the stable Eurasia plate have been also obtained (Figure 5). Velocity vectors have been estimated only for stations for which observations have been available in three and more years. The estimations agree very well with results from other investigations [Hefti, Igondova, 2009], [http://www.epncb.oma.be/_dataproducts/products/timeseriesanalysis], [Milev et al., 2010] [http://itrf.ensg.ign.fr/ITRF_solutions]. In all four seasons the main directions of the movement of all Bulgarian stations are south-east and they are in agreement with other investigations of this region [Stangl et al., 2008], [Milev et al., 2010], [Stangl, 2011]. The main direction of the movement of the most Greek stations is south-west and for some stations (LEMN, PRKV, ATAL, NOA1, PAT0, RLSO) the velocity gets to 20÷30 mm/y and they also agree with results from other investigations [Stangl et al., 2008], [Caporali et al., 2009], [Hefti, Igondova, 2009], [Becker et al., 2010]. Analysis of the seasonal solutionsThe total number of participated stations is increased from 17 in 2006 up to 40 (including IGS/EPN stations) in 2010. 29 of them are located on the territory of the Balkan Peninsula. The velocity estimations are obtained in IRTF2005. The BP station velocity vectors relative to the Eurasia plate have been obtained taking into account the recommendations of the EUREF Technical Working Group [Boucher, Altamimi, 2008]. First the IRTF2005 velocity vectors have been transformed into ITRF2000 and then into ETRF2000. The ETRF2000 results in North, East and Up components are compared and shown in Figure 6 for all four seasons.
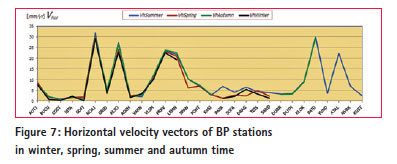
Comparison of the velocity estimations in North and East components shows identical results for stations which are observed in all seasons and in every year within the respective season. Variations of the values in both components are within 0,3÷2,5 mm/yr. The main reason for the discrepancies could be explained with the slightly different datums used in the processing of the seasonal data and not with the seasonal variations. Six IGS stations have been used in winter and spring data processing, and three more stations have been used in summer and autumn data processing. Another reason for higher discrepancies obtained could be the short time interval of station data participated in the processing. Some young stations (KLOK, PAT0, ATAL, DRAG, YUND) participated within the every season only with two year’s data or only in one or two seasons. Data availability is four and five years for the majority of the stations. As it is expected the discrepancies in Up component are 3÷5 times higher than the discrepancies in North and East components. ETRF2000 horizontal velocity vectors of BP stations have been also obtained for all four seasons and their trend is shown in Figure 7. The magnitude of the horizontal velocity vectors within the four seasons are kept the same for most of the stations (Figure 7). Only for some stations with two years data availability or for young stations directions agree not quite well.
The consistency of seasonal estimates of horizontal vectors is better than 0,2÷0,6 mm/yr for stations with small movements. Usually significant periodical seasonal variations are local phenomena with respect to the antenna monumentation, multipath and troposphere effects. Therefore it can be assumed that for the investigated period there is no significant impact of the seasonal variations on stations behavior and their movements are smooth and undisturbed within the four seasons. Higher differences of about 2,5÷4,0 mm/yr are obtained for stations with larger movements of about 10÷30 mm/yr (NOA1, LEMN, RLSO). The higher velocity differences obtained for stations DRAG, SAND, SOFA and TEIS cannot be assumed as effect of seasonal variations due to the shorter time span of observations within the seasons – only two years. Several stations are very young (ATAL, DUTH, KLOK, NVRK, PAT0) and their velocities are estimated only from processing of summer or autumn data and therefore they are not reliable. Obtained velocity estimations from this study have been compared with available results from other data processings. Generally, components of the velocity vectors or horizontal velocity vectors themselves agreWWe quite well. Nevertheless such a direct comparison is not a quite reliable approach for confirmation of the estimated velocities because different datum definitions and/or different ETRF realizations in GNSS data processing are used by different GNSS analysis centers or authors. ConclusionGeodynamic investigations have been accomplished on the base of GPS data of all free available GNSS permanent stations on the territory of the Balkan Peninsula within the time of four and five years in winter, spring summer and autumn seasons. The obtained velocity estimations agree very well with the ITRF2005 velocities within the particular seasons with some exceptions. Analysis of the obtained horizontal station velocity vectors relative to the Eurasia plate shows smooth, undisturbed linear trend of movement and it can be assumed that there is no significant seasonal impact on the station movements during the all seasons. Dominate linear motion is the behavior of the majority of the stations within all seasons. It is the reason to conclude that velocity estimations obtained from one week solutions in four or in five years time span are adequate with estimations obtained from long-term permanent observations. In case of non-permanently observed GNSS points this approach of estimation of horizontal station velocities shows reliable results which can be used for further geodynamical analysis and interpretations in other related geosciences. ReferenceBecker M., Caporali A., Stangl G., and the CEGRN Team. (2010). Update from Central Europe – The Improved Velocity Field from CEGRN Campaigns till 2009 and New Central European Research Initiatives. 15th General Assembly of WEGENER, 14-17 September, 2010, Istanbul, Turkey Boucher, C., Z. Altamimi. (2008). Memo: Specifications for reference frame fixing in the analysis of a EUREF GPS campaign. Caporali, A., C. Aichhorn, M. Barlik, M. Becker, I. Fejes, L. Gerhatova, D. Ghitau, G. Grenerczy, J. Hefti, S. Krauss, D. Medak, G. Milev, M. Mojzes, M. Mulic, A. Nardo, P. Pesec, T. Rus, J. Simek, J. Sledzinski, M. Solaric, G. Stangl, B. Stopar, F. Vespe, G. Virag. (2009). Surface kinematics in the Alpine-Carpathian–Dinaric and Balkan region inferred from a new multi-network GPS combination solution, Tectonophysics 474, 295–321. Caporali, A., M. Barlik, M. Becker, L. Gerhatova, G. Grenerczy, J. Hefty, A. Krauss, P. Legovini, D. Medac, G. Milev, M. Mojzes, M. Mulic, O. Odalovic, T. Rus, J. Simek, J. Sledzinski, G. Stangl, B. Stopar, F. Vespe, and G. Virag. (2011). The CEGRN 2011 Campaign and the densification of ETRF2000 in Central Europe. Presentation at the EGU General Assembly, Session G6.3, Vienna, Austria, 2012. Hefti, J., M. Igondova. (2009). Improved coordinate time series from reprocessing of permanent GPS stations in Central Europe. EUREF Annual Symposium, May, 2009, Florence. http://www.epncb.oma.be/_dataproducts/products/timeseriesanalysis/residual.php http://itrf.ensg.ign.fr/ITRF_solutions/ Milev, G., M. Becker, K. Vassileva, G. Stangl, I. Milev. (2010). Investigation of Geodynamics of Central and Eastern Europe, Balkan Peninsula and Bulgaria. In Monograph “Intelligent Data Analysis in Global Monitoring for Environment and Security”, ITHEA, Kiev-Sofia, 92-108. Stangl, G., C. Aichhorn, S. Krauss. (2008). Potential Networks and New Velocity Estimations for South-East Europe and the Orient. 14th General Assembly of Wegener, September 15-18, Darmstadt, Germany. Stangl, G. (2011).Velocity fields from geodesy to geodynamics. Presentation in the Seminar at the University Vienna, 04.12.2011. Vassileva, K. (2008). CERGOP GPS Data Processing and Analysis of the Results Related to the Region of the Balkans. Mitteilungen des Bundesamtes für Kartographie und Geodäsie, Band 40, EUREF Publikation, No 16, 388-397. Vassileva, K. (2009a). Processing and Analysis of GPS Data for Balkan Peninsula Permanent Stations. Proceedings of the International symposium on modern technologies, education and professional practice in geodesy and related fields Sofia, 05-06 November, 28-39. Vassileva, K. (2009b). Velocity analysis of Balkan Peninsula Permanent Stations from GPS solutions. Proceedings of the International symposium on modern technologies, education and professional practice in geodesy and related fields Sofia, 05-06 November, 40-48. Vassileva, K. (2010). Spring Behaviour of Balkan Peninsula Permanent Stations from GPS Solutions. Proceedings of the International symposium on modern technologies, education and professional practice in geodesy and related fields, Varna, Albena Resort, 23-24 September, 96-105. Vassileva, K. (2011). Investigation of summer behaviour of Balkan Peninsula GNSS permanent stations from GPS solutions. Geodesy, Cartography, Land Management, 5-6, 14-19. (in Bulg.) Vassileva, K. Analysis of the movements of Balkan Peninsula stations from GPS solutions in five autumn periods. (2012). International symposium on modern technologies, education and professional practice in geodesy and related fields Sofia, 08-09 November, 2012, 11 p. Vassileva, K. (2013). Three Seasonal Behaviour of the Balkan Peninsula GNSS Permanent Stations from GPS Solutions. Comptes rendus de l’Académie bulgare des Sciences, 2013, Volume 66, Issue No1, 77-82. |


 (8 votes, average: 3.63 out of 5)


Leave your response!