
| GNSS | |
Analysis of geomagnetic storm effects on GNSS TEC during ascending phase of solar cycle 25
A case study of (12 May, 17 April and 04 November 2021) geomagnetic storm at Abuja and Calabar Nigeria |
|
|
|
|
|
|
Abstract
This research was conducted in 2022, GNSS data were obtained in the Receiver Independent Exchange (RINEX) format. Retrieval analysis software developed by Gopi Seemela was utilized to extract vertical total electron content (vTEC) data, Disturbance Storm Time (DST) indices were employed for the purposes of storm detection and categorization. MATLAB was utilized to calculate the average TEC at hourly intervals. Additionally, the background diurnal TEC was determined by taking the median of the TEC values for 10-days period preceding and following the occurrence of storm events. By comparing the observed TEC to the background TEC, the response of TEC to the storm can be estimated. The results of this analysis show that during the May 12, 2021 geomagnetic storm event recorded in Abuja and Calabar stations. The maximum TEC recorded for Abuja station during the storm was 34 TECU, but the baseline TEC measurement was 28 TECU. Consequently, there was a 21.4% surge in TEC during the period; the peak value of the observed TEC during the storm was 29 TECU, while the corresponding background TEC value was 25 TECU, which gives a percentage increase of 20.8% during the time of the storm for Calabar station. Likewise, the storm event which occurred on November 04, 2021 recorded by Abuja station showed an increasing TEC value of 53 TECU, in contrast to the equivalent background value of 37 TECU. This suggests a percentage rise of approximately 43.2%. More also, the storm event which occurred on April 17, 2021 registered by Calabar station displayed a positive TEC response. The observed TEC was greater than the background TEC, especially after the storm peak time. In conclusion, the analysis of all the storm events recorded at Abuja and Calabar stations revealed significant TEC enhancement in comparison with the quiet days’ condition in all the stations. The results of this work will provide useful data which may assist system operators or any application that relies on GNSS data for effective operation.
1. Introduction
"Geomagnetic storm" is one of the most frequent globally disruptions thus far. Regardless of the time of year, it happens anywhere on earth. A worldwide disruption of the earth’s magnetic field is often referred to as a geomagnetic storm [1]. Solar radiation has a high density when it hits the atmosphere in the outer environment of the earth. The ionizing action of the sun’s radiation on the earth’s upper atmosphere produces free electrons, the number of which is sufficient above about 60 km to affect the propagation of electromagnetic waves. The distribution of high levels of radiation spans a spectrum that encompasses radio frequency, infrared radiation (IR), and X-ray. The plasma within the atmosphere’s highly ionized zone, characterized by intense X-ray and UV radiation, consists of charged particles, namely electrons and ions. The number of free electrons along the ray path of one-meter-squared cross section that extends all the way up from the ground through the ionosphere is referred as total electron content (TEC) or the electron columnar number density. Its unit TECU, 1 TECU equals to1016 electrons per square meter. The earth’s magnetic field experience perturbation due to the effects of geomagnetic storm which later cause changes in the ionospheric electron density and hence in ionospheric total electron content (TEC).
“Total electron content (TEC) is an important ionospheric parameter which can be used for many purposes, including the study of the ionosphere-plasmasphere system and Global Navigation Satellite Systems applications” [2]. “For example, one can get information about the ionization level of the ionosphere by measuring changes in the wave parameters when the signal transmitted by a satellite interacts with the ionospheric plasma” [3]. “On the other hand, it is known that TEC perturbations have a significant impact on satellite applications such as satellite navigation, communication, space weather forecasting, Global Positioning Systems (GPS) surveying, and remote sensing systems, which rely on an electromagnetic signal that interacts with ionospheric plasma when it passes through the ionosphere” [4,3,5].
“The strength of the geomagnetic storm is characterized by the minimum Disturbance storm-time (Dst) index and IMF-Bz” [6]. “Dst index is a quantitative measure of the energy injection into the ring current by the solar wind disturbance” [6]. “A typical geomagnetic storm usually consists of three major phases: storm sudden commencement (SSC) phase, which is characterized by an abrupt increment in Dst due to the compression of the magnetosphere by the shock wave hitting the Earth’s environment; the s tor m m ain phase, which is characterized by the build-up of the intensified ring current by high energetic particle injection; storm recovery phase which normally takes a little longer than the main phase; the recovery phase, when Dst returns to its pre-storm values. Recovery phase can last for several days” [7].
Understanding how the Space Physics phenomenon known as Space Weather affects human technology has grown more and more important as mankind has become more and more reliant on it [8]. Because of the Sun’s intense activity and the numerous unanticipated and unforeseen events that are occurring on its surface, we should be ready for the worst. The Sun’s alterations have an impact on the Earth’s surface, the atmosphere, and space. Most parts of space weather have some impact on us as our civilization becomes increasingly reliant on technology, and as space travel increases, so does the impact of space weather. The consequences it has on our daily lives on Earth are quite important. Dependence on technology has increased our vulnerability to bad space weather.In the past, only the most severe disruptions had an impact on technology; but, as our society now requires more advanced technology, this vulnerability may extend to less severe disturbances as well. Thus, there has been a lot of scientific interest in methods for forecasting space weather.
The interaction of the Earth’s magnetic field with magnetized plasma ejected from the Sun, which happens when enormous amounts of energy are transferred to the magnetosphere, causes geomagnetic storms, which are widespread disturbances. Although geomagnetic storm effects vary depending on the characteristics of each event, some common effects to most storms include a dayside compression of the magnetosphere [9], enhancement of magnetospheric currents [9], depletion and enhancement of trapped particles in the radiation belts [10], increased precipitation in the auroral regions, global response and the rapid transfer of enormous amounts of energy to the Earth’s magnetic field can also have significant effects on a variety of technological instruments, including damage and disruption to satellites and communication systems, jamming of radio signals, disruptions to the global positioning system, but they can also pose a threat to human exploration at high latitudes and high altitudes through increased radiation doses. “These events have the potential to cause technological disruptions, economic losses, and dangers to human life in the past and most likely in the future” [11]. The study of geomagnetic storm occurrence and their intensity over time is essential to improve our forecasting models and prevent or mitigate the risk associated with them.
Recent headlines such as "Space storms threaten technology", emphasizes how crucial it is to comprehend space weather phenomena.
Various researches on TEC response to geomagnetic activities has been carried out during the previous solar cycles, it will be necessary to also carry out a study analysis on geomagnetic storm effects on GNSS-TEC during this current solar cycle.
This research was carried out in 2022, which is a period at the ascending phase of solar cycle 25; it provides information on TEC response to geomagnetic activities over the selected locations.
1.1 The Study Area
Abuja currently serves as the political and administrative centre of Nigeria, functioning as the nation’s capital city. The location of this area is situated inside the central region of Nigeria, specifically within the Federal Capital Territory (FCT). Abuja is situated at an elevation of 1,180 feet (360 metres) above sea level, encompassing an area of 2,824 square miles (7,315 square kilometres). Abuja is situated at a latitude of 9.0667ºN and a longitude of 7.4951ºE. Calabar serves as the administrative centre of Cross River State, which is located in Nigeria. The region encompasses a total area of 406 square kilometres. Calabar is situated at a geographical position defined by a latitude of 4.9757°N and a longitude of 8.3417°E.
2. Materials and methods
2.1 Materials
The materials employed in this investigation encompassed ground-based GNSS receivers situated inside the designated study area, a GNSS dataset, a DST dataset, version 3.0.3 of the Gopi programme, and the Matlab software.
2.2 Methods
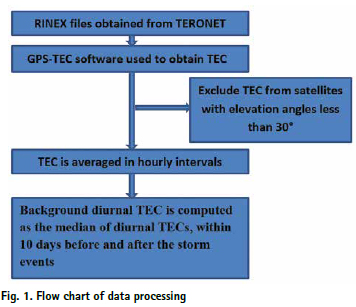
The data collected from the TERONET was acquired in the Receiver Independent Exchange (RINEX) format. The RINEX specification encompasses three distinct file types, namely the Observation file, Navigation file, and meteorological data file. The contents of each file comprise of a header section that contains pertinent information regarding the station, receiver, and antenna, followed by a main body that contains the actual data.
The retrieval analysis software, namely version 3.03, developed by Gopi Seemala, was utilized to extract vertical total electron content (vTEC) data from the RINEX files. The software possesses the capability to perform batch processing on input files, such as rinex files. This includes the ability to process all files within a given month or year, as well as all files associated with various stations or located within a specified directory. The software retrieves ephemeris data from the International GNSS Service (IGS) navigation file. It possesses the capability to automatically download the navigation file when an internet connection is available, unless the file is already present in the same directory as the data. The Total Electron Content (TEC) can be determined by analyzing the observation data obtained from the Global Positioning System (GPS) Rinex. The algorithm detects and corrects cycle slips in phase data, retrieves satellite biases from the International GNSS Service (IGS) code files for Differential Code Bias (DCB), and if these biases are not readily accessible, it computes them. The receiver bias is computed, and the calculations are performed.
The presence of inter-channel biases among many satellites in the receiver is a noteworthy aspect to consider. The software visually displays the vertical Total Electron Content (TEC) values on the computer screen and generates ASCII output files (*.CMN and *.STD) in the directory where the data file is located.
The estimation of the Total Electron Content (TEC) is facilitated through the utilization of dual frequency GPS measurements. This parameter holds significant importance in the characterization of the ionosphere and serves as a crucial input for data assimilative models. The Slant Total Electron Content (STEC) refers to the quantification of the total quantity of unbound electrons along a vertical column of unit cross-sectional area along the trajectory of the electromagnetic wave connecting the satellite and the receiver. The quantity of unbound electrons is directly related to the discrepancy in ionospheric delay seen at the L1 frequency of 1575.42 MHz. The L2 (1227.60 MHz) signals were provided.
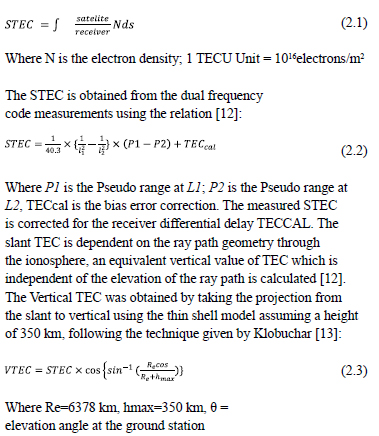
According to the findings of Rama Rao et al. [14], it was found that an Ionospheric Pierce Point (IPP) height of 350 km is applicable when the satellite elevation angle exceeds 50°. The data processing software utilized for the analysis of RINEX format data was developed by GOPI Krishna Samela, an esteemed researcher affiliated with the Institute for Scientific Research at Boston College in the United States [15,16].
Following the processing phase, the software generates data in various file forms. For the purpose of this study, the data was extracted in ‘ .std’ file types. In order to mitigate problems commonly seen with low-elevation satellites, such as multipath and tropospheric errors, exclusively data from satellites with elevation angles exceeding 30 degrees was utilized.
MATLAB is a programming language and computational environment that is proprietary and encompasses multiple paradigms. It has been developed by MathWorks, a company specializing in numerical computing. The MATLAB software platform provides users with the ability to perform various operations on matrices, generate visual representations of functions and data, execute algorithms, develop user interfaces, and establish connections with programmes developed in different programming languages. In this study, the software MATLAB was utilized to calculate the average Total Electron Content (TEC) at hourly intervals. Additionally, the background diurnal TEC was determined by taking the median of the TEC values for the 10-hour period preceding and following the occurrence of storm events. Finally, the graph depicting the background Total Electron Content (TEC) in conjunction with the observed TEC was generated using MATLAB. To examine the impact of individual geomagnetic storms on GNSS TEC, we analyzed data spanning a duration of 10 days prior to and 10 days following each storm. To assess the extent of the TEC’s reactions to individual geomagnetic storms, the median values of the diurnal TEC profiles were calculated for the ten days preceding and following the storm. These medians were then considered as the background TEC for subsequent analysis. The background total electron content (TEC) is calculated to model the anticipated TEC pattern during the period of low solar activity surrounding the occurrence of the storm event. By comparing the observed total electron content (TEC) to the background TEC, one can estimate the response of TEC to the storm. Fig. 1 depicts the various stages and methodologies employed, together with the software utilized for data analysis in the present study.
3. Results and discussion
The results of the study are presented in Figs. 2- 5
The results presented are discussed below;
Fig. 2 depicts the temporal variation of the Total Electron Content (TEC) in response to the geomagnetic storm that occurred on May 12, 2021 (day 132 of the year) at the Abuja station. The visual representation includes plots depicting the measured Total Electron Content (TEC) in blue and the background TEC in red. These plots are accompanied by equivalent measurements of the Disturbance storm time (Dst) magnitudes, both during and in the vicinity of the storm period.
Fig. 2 displays the observed and background Total Electron Content (TEC) values during and in the vicinity of the geomagnetic storm occurrence on May 12, 2021 (Day number 132). The observed Total Electron Content (TEC) is represented by the blue line, while the background TEC is represented by the red line. The lower panel displays the relevant Dst indices.
According to the data presented in Fig. 2, the primary phase of the geomagnetic storm event took place at approximately 15:00 UT. During this phase, there was a significant decline in the Dst index value from approximately 25 nT to -61 nT. Subsequently, the storm entered a gradual recovery phase, characterized by several hours of increasing Dst index values, eventually reaching -10 nT, as illustrated in the Dst curve. The presence of a positive total electron content (TEC) response may be shown in Fig. 2 for this particular storm. The measured total electron content (TEC) exhibits an increase compared to the baseline TEC, commencing several hours subsequent to the culmination of the storm on the 133rd day of the calendar year. The impact of the storm on the Total Electron Content (TEC) was notably favorable, as evidenced by a substantial disparity between the recorded TEC and the background TEC, particularly during the mid-day period following the peak of the storm. The maximum measured Total Electron Content (TEC) during the storm is 29 TECU, but the accompanying baseline TEC value is 25 TECU, resulting in a percentage increase of 20.8% during this period. According to a research conducted by Daniel and Samuel (2013) to study Total Electron Content (TEC) variation over Abuja using GNSS data obtained from the NIGNET (Nigeria GNSS Reference Network) for the OSGF (Office of the Surveyor General of the Federation) station located in Abuja (Geographic: 7.49 °E, 9.03 °N, altitude 533.60 m; Geomagnetic: 79.49 °E, 1.60 °S), in the months of May-July the peak TEC value are the range of 40-55 TECU, while the minima are in the range of 2.1-3.0 TECU. It can be seen in Fig. 2, the daytime measured Total Electron Content (TEC) levels were comparable to the equivalent background values before the occurrence of the storm event. However, commencing from the day subsequent to the culmination of the storm (during the phase of recuperation from the storm), the values measured during daylight hours surpass the comparable background levels.
There is a noticeable decrease in the disparity between the diurnal observed values and their matching background values subsequent to day 133.
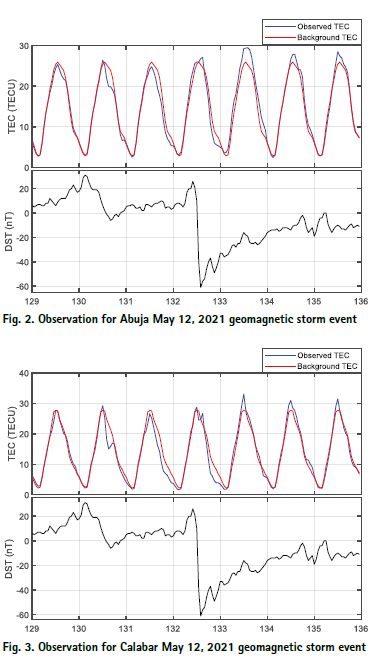
Fig. 3 depicts the TEC response to the geomagnetic storm that occurred on May 12, 2021 (day 132 of 2021), specifically at the Calabar station, in a manner akin to the presentation in Fig. 2.
Fig. 3 The top panel displays the observed and background Total Electron Content (TEC) values during and in the vicinity of the geomagnetic storm occurrence on May 12, 2021 (Day 132). The observed total electron content (TEC) is represented by the blue line, while the background TEC is represented by the red line. The lower panel displays the relevant Dst indices.
In a manner similar to the Abuja station, as depicted in Fig. 2, the Calabar station, illustrated in Fig. 3, reveals a favorable Total Electron Content (TEC) reaction to the aforementioned storm. The data shown in Figs. 2 and 3 indicate that comparable storm patterns are detected at both sites. The measured total electron content (TEC) exhibits an increase relative to the baseline TEC, commencing a few hours subsequent to the culmination of the storm on the 133rd day of the calendar year. The impact of the storm on the Total Electron Content (TEC) was found to be notably favorable, as evidenced by a substantial disparity between the recorded TEC and the background TEC, particularly during the mid-day period following the peak of the storm. The maximum Total Electron Content (TEC) recorded during the storm is 34 TECU, but the baseline TEC measurement stands at 28 TECU. Consequently, there is a 21.4% surge in TEC during this period. In a study conducted by Akinyemi et al., 2011 to determine the response of the Equatorial Ionesphere to a geomagnetic storm that occurred on 25 October, 2011, the storm caused enhancements in the TEC (positive storm effect) in comparison with the quiet condition’s TEC across Calabar station during both main and the recovery phases. During the storm of October 25, recorded peak enhancement in TEC was 14.8 %. Ikani and Oladipo 2018 conducted a research to estimate TEC gradient over Nigeria using GPS data for the year 2014 from seven out of fourteen operational NIGNET stations in Nigeria found between geomagnetic latitudes -4.33 and 0.72ºN, the results obtained show diurnal variation in TEC gradient values with the minimum values of TEC gradient recorded between 05:00 and 07:00 UT (~0.11-0.012 TECU) while the maximum values were observed between 14:00 and 16:00 UT (~0.54-0.55 TECU). According to Fig. 3, the daytime measured Total Electron Content (TEC) levels were comparable to the equivalent background values before the occurrence of the storm event. However, commencing from the day subsequent to the culmination of the storm (during the phase of recuperation following the storm), the values seen during daylight hours surpass the comparable values in the background. After day number 133, there is a decrease in the disparity between the measured values during the day and the matching background values.

Fig. 4 depicts the temporal variation of Total Electron Content (TEC) in reaction to the geomagnetic storm that occurred on November 4, 2021, which corresponds to day 308 of the year 2021. The provided data includes graphical representations of the observed Total Electron Content (TEC), denoted by the color blue, as well as the remaining plot.
The background of the TEC (Total Electron Content) parameter, represented in red, is presented in conjunction with the relevant Dst (Disturbance storm time) magnitudes observed during and in the vicinity of the storm period.
Fig. 4 The top panel displays the observed and background Total Electron Content (TEC) values during and in the vicinity of the geomagnetic storm occurrence on November 04, 2021. The observed TEC is represented by the blue line, while the red line represents the background TEC. The lower panel displays the relevant Dst indices.
According to the data presented in Fig. 4 the primary phase of the geomagnetic storm event took place at approximately 14:00 UT. During this period, there was a significant decline in the Dst index value, dropping from approximately 0 to just below -100 nT. Consequently, the storm is categorized as a robust geomagnetic storm occurrence. The storm underwent a protracted recovery period, characterized by multiple hours during which the disturbance storm time (Dst) index returned to approximately 0 nanoteslas (nT), as indicated by the Dst curve. As illustrated in Fig. 4, a predominantly positive total electron content (TEC) response is observed for this particular storm. Fig. 4 illustrates a temporal interval of approximately 10 hours in the Global Navigation Satellite System (GNSS) data at the onset of the geomagnetic storm. The cause of this data gap remains uncertain; nevertheless, it is plausible that it may be associated with the occurrence of GNSS signal disruptions caused by ionospheric irregularities created by the storm. Upon the resumption of GNSS data recording, the observations reveal a substantial increase in Total Electron Content (TEC) during midday, particularly in close proximity to the peak time of the storm. This increase is quite notable, reaching a value of 53 TECU, in contrast to the equivalent background value of 37 TECU. This suggests a percentage rise of approximately 43.2%. According to a research conducted by Daniel and Samuel (2013) to study Total Electron Content (TEC) variation over Abuja using GNSS data obtained from the NIGNET (Nigeria GNSS Reference Network) for the OSGF (Office of the Surveyor General of the Federation) station located in Abuja (Geographic: 7.49 °E, 9.03 °N, altitude 533.60 m; Geomagnetic: 79.49 °E, 1.60 °S), in the months of November and December the peak TEC value are the range of 56-58 TECU while the minima are the range of 2.5-3.5 TECU. It is observed from the results of Daniel and Samuel research that the VTEC values are relatively higher during the equinox’s months (March, April, August, September and October). This is expected since the sun (primary source of ionospheric ionization) is overhead the equatorial region (where the OSGF station used in their work is located) at this season.
Fig. 5 depicts the temporal variation of Total Electron Content (TEC) in reaction to the geomagnetic storm that occurred on April 17, 2021, which corresponds to the 107th day of the year 2021. The visual representation includes plots depicting the observed Total Electron Content (TEC) in blue and the background TEC in red, accompanied by the corresponding magnitudes of the Disturbance storm time (Dst) during and in the vicinity of the storm phase.
Fig. 5 The top panel displays the observed and background Total Electron Content (TEC) values during and in the vicinity of the geomagnetic storm occurrence on April 17, 2021. In this representation, the observed TEC is depicted by the blue line, while the red line represents the background TEC. The lower panel displays the relevant Dst indices.
According to the data presented in Fig. 5, the primary phase of the geomagnetic storm event took place at around 06:00 UT. During this period, there was a significant decline in the Dst index value, dropping from approximately -5 nT to -57 nT. This decline was followed by a steady recovery phase that extended over several hours, as depicted in the Dst curve. Additionally, it is worth mentioning that a positive Total Electron Content (TEC) reaction has been observed in relation to this storm. The measured total electron content (TEC) exhibits a higher value compared to the baseline TEC, particularly during the culmination of the storm event. A comparative study of Nigeria GNSS reference Network’s-Global Positioning System (NIGNET’s- GPS) vertical Total Electron Content (vTEC) measurements with the International Reference Ionosphere-Total Electron Content (IRITEC) predictions over Calabar Nigeria was carried out by Joseph et al., 2018,the results obtained show high hourly and diurnal correlation of about 0.9 with the IRI-TEC predictions for the days examined; thus supporting the viability of the receiver as a vTEC measuring device.
4. Conclusion
This paper has used storm that occurred on same day (12 May, 2021) at two stations (Abuja and Calabar) and also two storms (04 November, 2021 and 17 April, 2021) at two stations (Abuja and Calabar) as a case study to investigate and analyze geomagnetic storm effects on GNSS TEC during the ascending phase of solar cycle 25 across two stations in Nigeria. The storm event analysis revealed significant TEC enhancement in comparison with the quiet days’ condition in all the stations. The results of this work will provide useful data which may assist system operators.
Disclaimer (Artificial Intelligence)
Author(s) hereby declare that NO generative AI technologies such as Large Language Models (ChatGPT, COPILOT, etc) and text-to-image generators have been used during writing or editing of manuscripts.
Acknowledgements
This study was supported by Petroleum Technology Development Fund (PTDF) by meritedly awarding the in-country masters scholarship scheme which the authors gratefully acknowledged.
Competing Interests
Authors have declared that no competing interests exist.
References
1. Alberti T, Faranda D, Consolini G, De Michelis P, Donner RV, Carbone V. Concurrent effects between geomagnetic storms and Magnetospheric Substorms. Universe. 2022;8(4):226-230.
2. Stankov S, Stegen K, Warnant R. Seasonal variations of storm-time TEC at European middle latitudes, Adv. Space Res. 2010;46(10):1318–1325.
3. Jakowski N, Borries C, Wilken V, Introducing a disturbance ionosphere index (DIX),Radio Sci. 2012. DOI: 10.1029/2011RS004939
4. Habarulema JB, McKinnell L-A, Opperman BD. Towards a GPS-based TECprediction model for Southern Africa with feed forward networks, Adv. Space Res. 2009;44(1):82–92.
5. Borries C, Berdermann J, Jakowski N, Wilken V. Ionospheric storms—A challenge for empirical forecast of the total electron content, J. Geophys. Res. Space Physics. 2015;120:3175– 3186.DOI: 10.1002/2015JA020988
6. Gonzalez W, Joselyn J, Kamide Y, Kroehl H, Rostoker G, Tsurutani B, Vasyliunas V. What is a geomagnetic storm? J. Geophys. Res. 1994;99:5771–5792. Abailable:https:// doi.org/10.1029/93JA02867
7. Tsurutani BT, The interplanetary causes of magnetic storms, substorms andgeomagnetic quiet, in Space Storms and Space Weather Hazards, Daglis, I.A., Ed., Dordrecht: Kluwer. 2001;103–130.
8. Aragaw M, Gebiregiorgis A, Tsegaye K. Solar activity and geomagnetic storm effects on GPS ionospheric TEC over Ethiopia. Momona Ethiopian Journal of Science. 2019;11(2):276-300.
9. Reyes PI, Pinto VA, Moya PS. Geomagnetic storm occurrence and their relation with solar cycle phases. Space Weather. 2021;19(9):741-749.
10. Pandya M, Bhaskara V, Ebihara Y, Kanekal SG, Baker DN. Variation of radiation belt electron flux during CME-and CIR-driven geomagnetic storms: Van Allen Probes observations. Journal of Geophysical Research: Space Physics. 2019;124(8):6524-6540.
11. Worman S, Taylor S, Onsager T, Adkins J, Baker DN, Forbes KF. The social and economic impacts of moderate and severe space weather. In Extreme Events in Geospace. 2018;13(8):701-710. Abioye A, Atanda PO, Majolagbe SB, Isadare DA, Abioye OP, Akinluwade KJ, Adetunji AR. Material selection for gas turbine blade coating using GRANTA material selector. Advances in Research. 2015;5(1):1- 9. Abailable:https://doi.org/10.9734/ AIR/2015/15769 Onwuzuruike B, Jessica A, Maruf A. Aminu. Experimental determination of panel generation factor for apo area of federal capital territory in Nigeria. Journal of Scientific Research and Reports. 2019;24(3):1-5. Abailable:https://doi. org/10.9734/jsrr/2019/v24i330157
12. Bagiya MS, Joshi HP, Lyer KN, Aggarwal M, Ravindran S, Pathan BM. TEC variations during low solar activity period (2005-2007) near the equatorial ionospheric anomaly crest region in India. In Annales Geophysicae. 2009;27(3):1047- 1057. Copernicus GmbH
13. Klobuchar JA. Design and characteristics of the GPS ionospheric time delay algorithm for single frequency users. In PLANS’86–Position Location and Navigation Symposium. 1986;1:280-286
14. Rama Rao, Niranja, K., Gopi Krishna, S., and Uma, G. On the validity of ionospheric pierce point (IPP) altitude of 350km in the indian equatorial and low-latitude sector. In Annales Geophysicae. 2006, September ;24(8):2159-2168.
15. Labitzke K. On the solar cycle– QBO relationship: A summary. Journal of Atmospheric and Solar-Terrestrial Physics. 2005 Jan 1;67(1-2):45-54.
16. Hathaway DH. The solar cycle. Living reviews in solar physics. 2015 Dec;12(1):4.
Disclaimer/Publisher’s Note:
The statements, opinions and data contained in all publications are solely those of the individual author(s) and contributor(s) and not of the publisher and/or the editor(s). This publisher and/ or the editor(s) disclaim responsibility for any injury to people or property resulting from any ideas, methods, instructions or products referred to in the content.
The paper is originally published in Asian Research Journal of Current Science Volume 6, Issue 1, Page 152- 162, 2024; Article no.ARJOCS.1625. © Copyright (2024): Author(s).
The licensee is the journal publisher. This is an Open Access article distributed under the terms of the Creative Commons Attribution License (http://creativecommons.org/licenses/ by/4.0), which permits unrestricted use, distribution, and reproduction in any medium, provided the original work is properly cited. The article is republished with author’s permission