| GNSS | |
Anatomy of Origin-Destination Matrix derived from GNSS alternatives
Origin-Destination Matrix (ODM) has been considered a traditional tool for transport development, being established on interviews and traffic counting. Here we present a novel approach in the ODM estimation using data related to telecommunication activity, as well as the advanced methods for the ODM visual presentation and interpretation. Our approach does not only aim at assisting transport developments, but also at supporting the largerscale urban strategic development in relation to identified socio-economic activity |
 |
|
 |
|
 |
|
 |
|
 |
|
The urban development strategic spatial planning heavily relies upon the identification of the patterns off socioeconomic activity. A proper assessment of the socio-economic activity level requires careful spatio-temporal segmentation of the area targeted for strategic planning, and a systematic and accurate collection and analysis of the field measurements. The appropriate identification of the areas of socio-economic activity (office areas, residential areas, schools and universities, shopping m12alls, concert halls, and sport facilities, as examples) at an appropriate scale allows for strategic planning of the urban development, including expansion and modernisation of road and railway networks, public transport system, expansion of residential areas, improvement of urban infrastructure etc.
Origin-Destination Matrix (ODM) is a known measurement tool for socioeconomic activities, particularly used in transport segment. An ODM is defined by spatially segmented areas of supposed socio-economic activity, and a time window suitably chosen to reflect the nature of local migrations related to the socio-economic activity. As an example, the ODM defined in the time-window 06 h – 09 h will describe the local migration related to the start of daily business, education and health activities, with majority of the population conducting migration in order to get to their offices, plants, schools, universities or health services. The intensity of migration between identified origins of migrations (mostly homes, for the (06-09) hours interval) and their destinations (areas with offices, production plants, universities, schools and hospitals) is an invaluable information for every strategic planner.
Traditional concept of the ODM estimation calls for field data collection using interviews, readings of (as numerous as possible) sensors in the field, including CCTV systems and road inductive loops, and the similar time- and effort-consuming methodologies. As the name implies, an ODM consists of matrix elements, where everyone presents the number of migrations between the i-th origin and the j-th destination. Almost all ODM estimation methods return the ODMs that estimates the spatial distribution of socioeconomic activities partially, assessing only Here we propose a novel approach for a seamless, efficient and the more general assessment of spatially segmented socio-economic activity through utilisation of the ODMs estimated from data sets collected in mobile communication networks. The socalled Call Data Records (CDRs) are routinely collected for the billing purposes, and comprise the information on the telecommunications transactions (events) including: time of the initiation of transaction, the ID and position of the base station that served the transaction initiation. With the user IDs modified to assure the anonymity and privacy, the CDRs become invaluable source of data for the ODM estimation. While the data sets do not contain any positioning information derived or obtained from the GNSS readings, the proposed concept can be understood as the method for te ODM estimation from the GNSS alternatives.

The proposed approach to the ODM estimation comprises a number of tasks, as depicted in Figure 1.
During the data preparation phase, the reduced CDRs are split into daily timewindows, determined by the known general patterns of daily socio-economic activity, but also by local traditions. Data can be split further taking into account if the day under observation was within the working week or not. The temporal segmentation into time-windows allows for statistical identification of established patterns, while at the same time attenuating insignificant and occasional anomalies through averaging.
Origin and destination identification task aims at identification of the focal points of socio-economic activity which the migrations either originates from, or destine to. The identification process is performed through utilisation of the temporal filter that identifies the areas (related to base stations) where mobile users spent large time spans.
A delicate task of the migration identification is accomplished using spatiotemporal information filtering that returns origin-destination pairs (ODP) based on the estimation distance of migration and the time spent to perform it.
After the identification of the ODPs, a simple migration counting is performed, that returns the number of migrations between every origin and destination areas (base stations) as a measure of attractiveness and intensity of the origins and destinations as the centres of socio-economic activity.
All origin-to-destination counts are then arranged into matrix form, thus creating the ODM estimate.
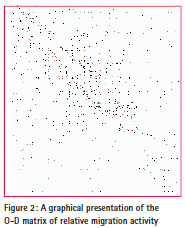
The number-filled ODM does not present the information in a comprehensive form. In due course we developed several methods to graphically present the ODM thus rendering it more comprehensive and revealing the evidence hidden behind the plain numbers. The outcomes of the methods utilised are presented in Figures 2, 3, and 4, respectively.


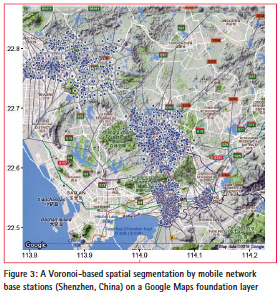
Figure 2 depict a graphical presentation of an ODM map in a heat map-like manners. The presentation is achieved through normalisation of the absolute counts in the ODM with the count of the most intense migration event in the time-window under observation. A hexagonal spatial segmentation, commonly utilised in telecommunications segment, does not represent the areas of socio-economic activity in the appropriate way, since it assumes the equally-sized spatial cells The Voronoi diagram spatial segmentation of the ODM targeted area has been selected for determination of the origin and destination areas, due to its variability in size that can be related to the density of the base station spatial distribution. In that way, the contextual information (the area’s attractiveness for socioeconomic activity) is more pronounced and assist in the ODM interpretation. An example of the Voronoi-based spatial segmentation is shown in Figure 3.
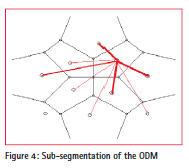
Finally, the expert system for the ODM estimation allows for targeted migration analysis. As an example, an ODM subset may be used to present the most important migration direction for a selected origin, as depicted in Figure 4.
A novel approach we utilise in the ODM estimation, graphical presentation and interpretation allows for advanced information extraction from the ODM as traditionally used tool in transport. Our approach provides:
– Improved estimation of local migrations, based on telecommunications activity data (anonymised CDRs), that encompasses much broader activity of population, including the individual mobility that is not related to conventional means of transport (cars, public transport vehicles, railways);
– Improved identification of the spatial area of socio-economic attractiveness through information sensor fusion, deployment of Voronoi-based spatial segmentation, and contextual spatio-temporal filtering of telecommunications activity data (anonymised CDRs);
– A novel ODM visual presentation the allowed for advanced ODM interpretation and inference.
James Stewart stirred the world with his 1956 movie Anatomy of the murder, not only because of his brilliant acting, but also for the then-controversial subject addressed. This paper is far from being expected to achieve anything similar, but its authors will be more than delighted, if the research presented rises the attention of the feasibility to use the GNSS alternatives as both the valuable source of information and reliable assistance to GNSS in transport and telecommunications segments.
Reference
Crawley, M J. (2013). The R Book (2nd ed). John Wiley & Sons. Chichester, UK.
Doyle, J. (2014). Estimating Movement from Mobile Telephony Data (PhD thesis). National University of Ireland. Maynooth, Ireland.
Filić, M, Filjar, R, and Vidovic, K. (2016). Graphical presentation of Origin-Destination matrix in R statistical environment. Accepted for publication in Proc of KoREMA Automation in Transport 2016 Conference (4 pages). Krapina, Croatia.
Filjar, R, Jezic, G, and Matijasevic, M. (2008). Location-Based Services: A Road Towards Situation Awareness. J of Navigation, 61, 573-589. doi:10.1017/S0373463308004864
Florez, M et al. (2016). Measuring the impact of economic well being in commuting networks – A case study of Bogota, Colombia. Available at: http://bit.ly/2cVpihm, accessed on 20 September, 2016.
Gonzalez, M C, Hidalgo, C A, and Barabasi, A-L. (2008). Understanding individual human mobility patterns. Nature, 453, 779- 782. doi:10.1038/nature06958
Hasan, S et al. (2012). Spatiotemporal patterns of urban human mobility. J of Stat Phys, 151, 304-318.
Peterson, A. (2007). The Origin- Destination Matrix Estimation Problem – Analysis and Computations (MSc thesis). Linkoeping University. Norrkoeping, Sweden. Ratti, C et al. (2010). Redrawing the Map of Great Britain from a Network of Human Interactions. PLoS One, 5(12), e14248. doi: http://dx.doi. org/10.1371/journal.pone.0014248. Available at: http://bit.ly/2cGTeL4, accessed on: 22 September, 2016.
Toole JL, Herrera-Yaque C, Schneider CM, Gonzalez MC. (2015). Coupling human mobility and social ties. J. R. Soc.
Interface 12: 20141128. http:// dx.doi.org/10.1098/rsif.2014.1128. Available at: http://bit.ly/2d0GWBp, accessed on 10 September, 2016.
Vidovic, K, Lucic, A, and Saric, D. (2016). Methodology of O-D Matrix determination from telecommunication Charging Data Records. Accepted for publication in Proc of KoREMA Automation in Transport 2016 Conference (4 pages). Krapina, Croatia.
Wang, P et al. (2012). Understanding Road Usage Patterns in Urban Areas. Scientific Reports, 2, e01001. doi: 10.1038/srep01001


 (No Ratings Yet)


Leave your response!