| Disaster Management | |
Responding to the Great East Japan Earthquake
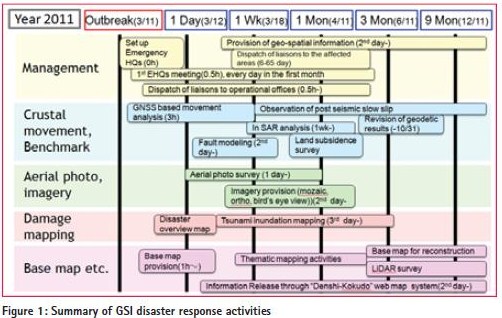
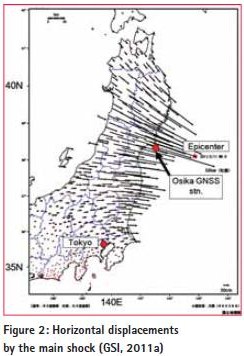
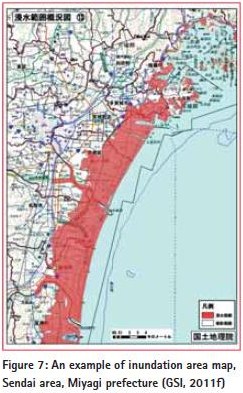
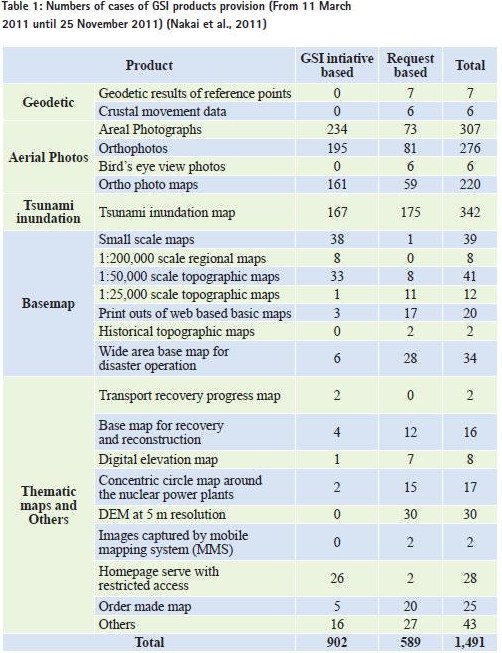
Geospatial Information Authority of Japan (GSI) conducts national surveying and mapping administration. Historically, it dates back to 1869 when the Cadastral Registration Map Section was established in the office of Geography Department, Ministry of Civil Service. Later in 1888, it was reorganized as Japanese Imperial Land Survey, and then it became the Geographical Survey Institute in former Home Ministry in 1945. Its official English appellation was changed to ‘Geospatial Information Authority of Japan’ in April 2010. Main measures and activities of GSI are: – Observing and providing positional information (longitudes and latitudes) of land and elevations from the mean sea level, with ground control point infrastructure including GNSS Earth Observation Network System (GEONET); – Providing and publishing base maps (1/25,000 topographic map series etc.), thematic maps (land use map, etc.), DEM as well as aerial photographs, by paper, digital and web-mapping formats; and – Executing the Survey Act and the Basic Act on the Advancement of Utilizing Geospatial Information (i.e., Japanese NSDI law), jointly with relevant government organizations. The headquarters are located in Tsukuba city, Ibaraki prefecture, 50 km northeast from Tokyo, the capital of Japan. GSI has ten regional survey departments to implement activities at the regional level. The number of staff members is 711 in 2012. The delegated budget (including both human and capital cost) in fiscal year 2012 was 10.2 billion yen (ca. US$ 130 million). In Japan, the Disaster Measures Basic Law was established in 1961 as a national framework for measures against natural disasters. Being designated as one of the responsible administrative organs under the purview of Law in 2001, GSI has developed its Disaster Management Operation Plan. The Plan describes the principles of measures and activities in the disaster operation cycle. According to the Plan, GSI has established the Disaster Management Operation Manual and Business Continuity Plan (BCP), which prescribes mobilization of the organization in disaster response phase. Establishing rules and manuals is not the only assurance of a good performance during an actual disaster response. A number of drills have been regularly exercised in Japan at all levels to establish quick responsiveness and resource mobilization. GSI also conducts similar drills organized by the national government and themselves several times a year. Major GSI’s disaster response experiences prior to the Great East Japan Earthquake were: Great Hanshin-Awaji Earthquake (1995), Mt. Usu volcanic eruption (2000) and Niigata-ken-Chuetsu earthquake (2004). Great East Japan EarthquakeThe 2011 off the Pacific coast of Tohoku Earthquake, the main shock, occurred at 14:46 (JST: Japanese Standard Time) on 11 March 2011. The epicenter was located about 130 km ESE from Osika peninsula, Miyagi prefecture and 24 km in depth (JMA, 2012). The hypocentral area of the earthquake in the boundary between the Pacific plate and the continental plate extended 400 km in N-S and 150 km in E-W directions. Moment magnitude (Mw) of the earthquake was estimated at 9.0, which is the largest in Japanese observation history and the fourth largest in the world since 1900 (USGS, 2012). Terrible shakes were felt in large areas of the country. It also brought the huge tsunami which washed victims and properties away. The total number of dead and missing as of October 2012, amounted to 18,649 (NPA, 2012). Most victims were in Iwate, Miyagi and Fukushima prefectures. More than 90% of casualties were caused by the tsunami. Buildings and infrastructure were almost destroyed in the tsunami stricken areas. The disaster triggered a severe accident at the Fukushima Daiichi Nuclear Power Plant. Because the ECCS (Emergency Core Cooling System) of the Plant got damaged and didn’t work, nuclear reactors were affected by the melting nuclear fuel, causing the emission of radioactive materials into the environment. Many residents around the Plant had to evacuate to avoid radiation exposure and have been enduring a difficult life since then. Thanks to the completion of the base isolation (earthquake-free) system in December 2010, the main building of GSI headquarters was unharmed. Those in the organization were safe. Among 1,240 GNSS-based control stations throughout the country, one station was totally washed away and two stations were damaged by the tsunami. In addition, GSI’s Soma tidal station in Fukushima prefecture was totally devastated by the tsunami. Response managementGSI entered into emergency status and set up emergency headquarters (EHQs) immediately after the main shock. EHQs served as the decision making body during the disaster operation. The first EHQs meeting was held at 15:10, on March 11 (JST), just twenty four minutes after the main shock. Chaired by the Director- General of GSI, executives discussed and decided the necessary actions to be taken in EHQs meetings. Figure 1 shows the summary of GSI disaster response activities. It also dispatched its liaisons on 24-hour per day basis for two months to relevant government organizations in order to identify the needs of geospatial information and provide GSI’s products. Further, GSI sent its liaisons to local disaster operation centers to deliver geospatial products for use in field operation. Major disaster response activities are described in the following sections. Ground surface movementsAfter the main shock, GSI tried its best to get initial results of ground surface movements detected by GEONET, which consists of 1,240 GNSS-based control stations and the central analysis unit. After a week, it revealed that Osika station, closed to the epicenter of the main shock, moved 5.3 m eastward and subsided 1.2 m, the largest movement ever observed by GEONET (Figure 2 and 3). It is notable that a large post-seismic slipping movement occurred after the main shock. This post-seismic movement amounted to 101 cm at Yamada GNSSbased control station in Iwate prefecture by September 2012. The total energy released during the movement was estimated at 8.62 at the scale of moment magnitude (Mw) (GSI, 2011b). This movement made decision making difficult in justifying the timing of determination and announcement of new geodetic results in affected areas (Yamagiwa et al., 2012). GSI also detected surface movements by applying SAR (Synthetic Aperture Radar) interferometry (InSAR) method. Original data captured by PALSAR sensor was loaded on ALOS (Advanced Land Observation Satellite) by JAXA (Japan Aerospace Exploration Agency). As shown in Figure 4, surface movements detected by InSAR analysis were concordant with those detected by GEONET (GSI, 2011c). Aerial photo surveyIt is imperative for geospatial organizations to take quick action in acquiring imagery for damage reconnaissance in any circumstance. Since GSI’s survey aircraft was in statutory inspection, the first thing GSI aerial survey team did was to ensure the availability of survey aircrafts of private companies, in cooperation with an association of aerial survey companies. Six companies responded to the emergency request by GSI on that day. In parallel, GSI also asked relevant organizations for their areas of interest for damage reconnaissance to make aerial survey plan. Due to nice weather, the air crew teams took aerial photos of major damaged areas on March 12 and 13. The remaining areas were taken in the following survey missions. The final aerial photo coverage is depicted as the blue areas in Figure 5. Quick image processing enabled GSI to deliver the imagery to major government organizations and uploaded it to GSI’s website from March 14, 2011, onwards. Some people gratefully reported that they were relieved to make sure that their friends’ house was not damaged nor broken by the tsunami only by viewing the photographs on the website. A series of aerial photo data included: single frame photos, orthophotos, orthophotomap (Figure 6) (orthophoto overlain by line map), as well as pairs of orthophotos (before and after the tsunami) and oblique view photo in some areas. Tsunami inundation mappingWhen it became clear that most damages were caused by the massive tsunami that took place the day after the main shock, identification of tsunami inundation areas became of high priority for rescue activities. GSI organized a team for inundation mapping on March12, 2011. The team started photo interpretation to delineate inundation areas as soon as the first aerial photographs became available in the afternoon of March 13. One thousand nine hundred aerial photos were used to make the first version of inundation map which was available to the public on March 14. Several updates were made with additional aerial photographs. Eventually the team found that 561 sq km was inundated by the tsunami. An example of the inundation map is shown in Figure 7. The pink areas are inundated areas in the figure. Provision of base maps and thematic mapsResponding to the high needs of base maps (topographic maps etc.,) for disaster operation management, GSI also delivered them to requesting organizations mainly in paper form. Several kinds of thematic maps were also produced. One example is the evacuation zoning map (Figure 8). The government designated evacuation zoning areas around Fukushima Daiichi Nuclear Power Plant on April 22, 2011. Accordingly, GSI produced the map in collaboration with Cabinet Secretariat disaster operation center and made it open to the public. Provision of geospatial information and its useGSI’s disaster related products were mainly provided through four channels. The first channel was humanitarian relief transportation system operated by JSDF (Japanese Self Defense Force). The second was providing information through GSI liaisons attached to local disaster headquarters. The third was provision through the Geospatial Information Support Team. Under EHQs, this team acted as the one-stop center of provision of products to meet high demands of geospatial information from public organizations. The forth provision was through the website (www.gsi. go.jp) mainly targeting the general public. Table 1 shows the numbers of cases of provision by the second and the third channels. A total of 1,491 cases were handled (Nakai et al., 2011). Among the organizations that would send their requests, 90% were central and local government organizations. In addition to the cases summarized in Table 1, much more products were browsed and downloaded through the website.
The following list shows a few examples of use of geospatial information by relevant organizations: – Damage identification, issuance of building damage certification to citizens (local governments); – Operation of searching for dead bodies (police, Self Defense Force); – Facility damage identification (Ministry of Land, Infrastructure, Transport and Tourism); – Consideration of exemption from property tax by local governments in damaged areas (Ministry of Internal Affairs and Communications), and – Enterprise affection evaluation (corporate analysis consultants). Reconstruction support activitiesNot only disaster response activities, but GSI also redeveloped geospatial base in support for reconstruction activities in damaged areas. The first activity is the revision of geodetic framework. The large ground surface movements by the earthquake required total revision of coordinates of ground control points in the area. First, the results of GNSS-based control stations were revised by the end of May 2011. In succession resurvey of 1,900 triangulation points and 1,900 bench marks was implemented. The results were eventually integrated into the ‘Japanese Geodetic Datum 2011 (JGD2011)’ in October 2011. The detailed aspects of this work are precisely reported in Yamagiwa et al. (2012). Secondly, a series of aerial photographs and 1:2,500 base maps in support of reconstruction planning were developed for the damaged areas of 5,320 sq km. The products have been available since January 2012. Furthermore, LiDAR survey covered 10,876 sq km of coastal areas affected by the tsunami and mountain areas vulnerable to landslides to produce DEM at 5 m (partly 2 m) resolution. Furthermore, coastal LiDAR survey at 5 km swath was conducted in the areas outside the damaged areas, to prepare tsunami hazards in future. Achievements and challengesThe following achievements were identified as a result of GSI’s disaster response activities. – A chain of quick actions of data gathering and development enabled GSI to release its products from the early period of disaster response. This achievement owes to the experiences accumulated among the staff, regular drilling and necessary provision of equipment in advance. – Devising new arrangements for efficient data delivery: Geospatial Information Support Team performed well in providing data, interacting with requesters on their needs. Collaborations with other government organs for data delivery to difficult areas also worked. Posting liaison to disaster operation offices was also effective to catchup with rapidly changing geospatial needs of organizations according to post disaster phase development. – A wide range of usage of GSI geospatial information products was recognized, quantitatively and qualitatively. In fact, this huge disaster gave GSI an opportunity to demonstrate its capability of damage reconnaissance and supporting reconstruction activities. Meanwhile, the following challenges were also recognized and urged GSI to further improve its disaster response capabilities. – Resiliency and redundancy of energy, communication and facilities: Some data from GNSS-based station were lost or unable to send due to the destruction of communication and power failures. Supplementary battery did not allow the stations to work more than 72 hours after power outage. By external failures, GSI headquarters were also struck by power outage and internet disconnection. These problems made GSI reinforce its back up equipment such as auto generator, water storage and other facilities. – There are still rooms for more efficient information development and rapid provision. After the disaster, GSI reviewed its response activities, found problems and proposed solutions for further improvement. Some of the solutions were tested in disaster response drills thereafter. – Not all the users were satisfied with GSI’s data provision. Particularly, some volunteers in the mapping community which emerged in recent years for disaster response were not satisfied with the technical and policy aspects of GSI’s data provision. Their point reflects GSI’s emphasis on products provision to rescue and recovery organization (mostly public) and non-professional general public through its website. GSI needs to optimize its performance to satisfy diversified data needs in emergency through establishing public relations with various stakeholders during inter-disaster periods. ConclusionsGSI conducted response activities at full strength against the tragic East Japan Great Earthquake. GSI’s Geospatial information was well utilized by various people and organizations in disaster response activities. Meanwhile, new challenges were recognized through the experience, prompting continuous improvement of disaster response capabilities. As occurrence of natural disasters never ends, national mapping agencies or equivalent geospatial organizations in each country need to make their best efforts to provide stakeholders with necessary geospatial information products in emergency. In this context, we hope our experience would be informative and encouraging for our colleagues in the fields of disaster and emergency response and management. ReferencesGSI (2011a): Crustal movements of GNSSbased control stations by GNSS earth observation (Japanese), in http://www. gsi.go.jp/chibankansi/chikakukansi40005. html (accessed 09/10/2012) GSI (2011b): Post seismic movement and slip distribution model by the analysis of GNSSbased control station data (Japanese), in http://www.gsi.go.jp/cais/topic110314- index.html (accessed 09/10/2012) GSI (2011c): Capturing area-wide crustal movement by the 2011 off the Pacific coast of Tohoku Earthquake, final version (Japanese), in http://www.gsi. go.jp/uchusokuchi/uchuusokuchi40010. html (accessed 09/10/2012) GSI (2011d): Aerial photographs of affected areas and around (Japanese), in http:// portal.cyberjapan.jp/denshi/index3_ tohoku.html (accessed 10/10/2012) GSI (2011e): Orthophoto map of Sanriku Minami area (2) (Japanese), in http:// saigai.gsi.go.jp/h23taiheiyo-zort/ map/sanrikus/index_sanrikus_N. html (accessed 10 /10/2012) GSI (2011f): Inundation area map at 1:100,000 scale (Japanese), in http:// www.gsi.go.jp/kikaku/kikaku60003. html (accessed 10/10/2012) GSI (2011g): Maps related to Fukushima nuclear power plant accident (Japanese), in http://www.gsi.go.jp/BOUSAI/ h23genpatsu.html (accessed 10/10/2012) JMA (Japan Meteorological Agency) (2012): The 2011 off the Pacific coast of Tohoku Earthquake -Portal-, in http://www.jma. go.jp/jma/en/2011_Earthquake/2011_ Earthquake.html (accessed 09 /10/2012) Nakai, H., T. Nagayama, T. Hayashi, M. Tsukui, H. Segawa, K. Akiyama, and S. Matsumoto (2011): Actions of GSI in response to the Great East Japan Earthquake (Japanese), in Kokudochiriin Jiho, 122, 1-10 NPA (National Police Agency) (2012): Damage Situation and Police Countermeasures associated with 2011 off the Pacific coast of Tohoku Earthquake (Japanese), in http:// www.npa.go.jp/archive/keibi/biki/ higaijokyo.pdf (accessed 23/10/2012) USGS (United States Geological Survey) (2012): Largest Earthquakes in the World since 1900, in http://earthquake. usgs.gov/earthquakes/world/10_largest_ world.php (accessed 09/10/2012) Yamagiwa, A., Y. Hiyama, T. Yahagi, H. Yarai, T. Imakiire and Y. Kuroishi (2012): Revision of survey results of control points after the 2011 off the Pacific coast of Tohoku earthquake. FIG 2012 proceedings, http://www.fig.net/pub/fig2012/papers/ ts03k/TS03K_hiyama_yahagi_et_ al_5910.pdf (accessed 10/10/2012
|


 (4 votes, average: 3.00 out of 5)


