| GNSS | |
GNSS (SBAS) Constellation Specific Monthly Analysis Summary: February 2026
The analysis performed in this report is solely his work and own opinion. |
 |
|
Introduction
This article continues the monthly performance analysis of the GNSS constellation. Readers are encouraged to refer to previous issues for foundational discussions and earlier results. However, due to time constraints and planned restructuring of monitoring parameters, this month’s issue focuses solely on the global SBAS performance during recent high solar storms. The results were also presented at the UNOOSA, Space Weather Initiative workshop, Vienna, June 2025. From next month, it is planned to have a consolidated GNSS (GPS, GAL, BDS) +SBAS+NAVIC performance monitoring monthly.
Readers are also encouraged to go through the previous article on the SBAS performance to get technical details on the system (https://mycoordinates.org/ pdf/aug23.pdf ; https://mycoordinates. org/gagan-performance-assessment for-aircraft-precision-approach/)
1. SBAS Performance
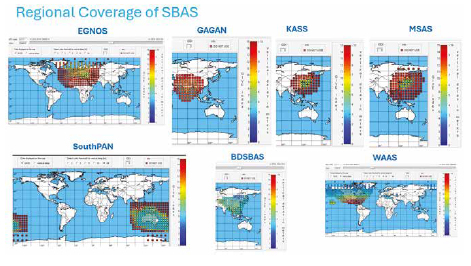
SBAS networks—including EGNOS (Europe), WAAS (USA/Mexico), GAGAN (India), MSAS (Japan), KASS (Korea), BDSBAS (China) and SouthPAN—augment GNSS by transmitting ionospheric corrections, integrity bounds, and protection levels. The coverage map below provides an overview on the geographical regions and associated grids for each SBAS system. These are essential for enabling aircraft precision approach operations such as APVI, APVII, and LPV200. Ionospheric disturbances, especially during geomagnetic storms, pose the greatest natural hazard to GNSS-based navigation, increasing ionospheric delay, error uncertainty (GIVE/GIVEI), and integrity risk. The May 2024 storm provided a unique opportunity to observe SBAS behavior under extreme space-weather conditions.
2. Understanding the Metrics
To interpret SBAS performance plots, three metrics are fundamental:
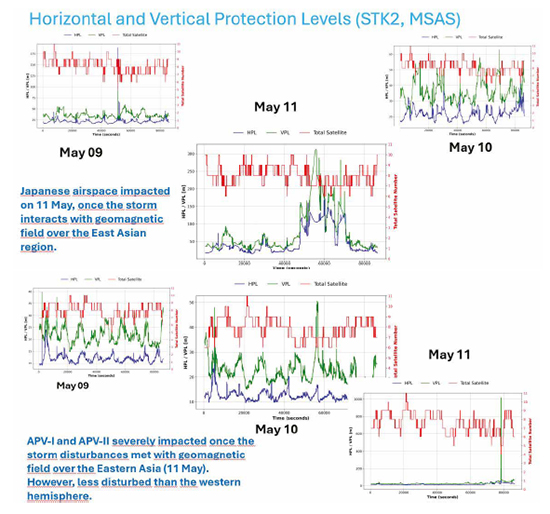
HPL (Horizontal Protection Level): Represents the confidence bound on horizontal position error. When HPL exceeds aviation alert limits, operations such as RNP 0.3 or RNP 0.1 become unavailable which also means APV-I/II/LPV becomes unattainable.
VPL (Vertical Protection Level): Vertical integrity bound, more sensitive to ionospheric errors. Thresholds include APVI (50 m) and APVII/LPV200 (35 m). Any spike above these limits makes approach procedures unavailable.
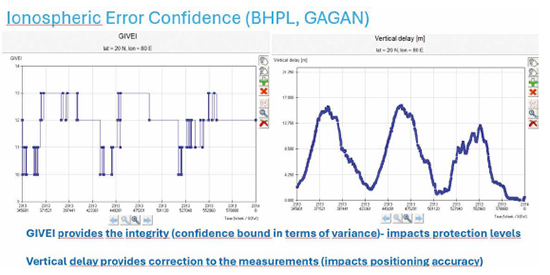
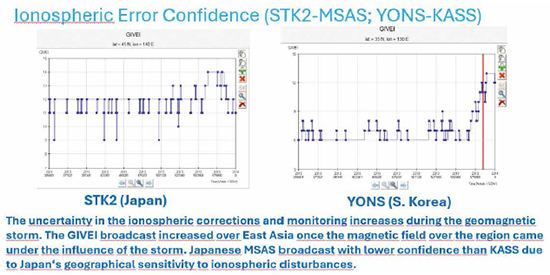
GIVEI (Grid Ionospheric Vertical Error Indicator): Encodes SBAS confidence in ionospheric corrections at each grid point. Higher values indicate higher uncertainty. GIVEI = 15 denotes an unmonitored ionosphere region, forcing SBAS to inflate protection levels dramatically. These metrics explain most behavior observed during the May 2024 storm.
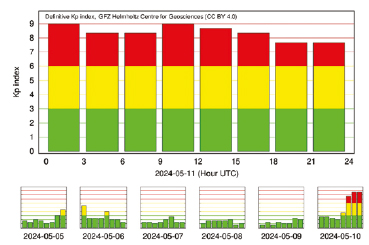
3. Space Weather Event: May 10–11, 2024
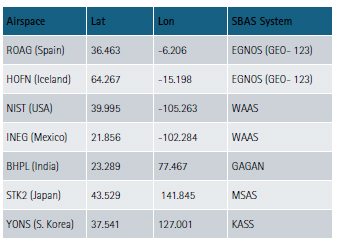
The May 2024 storm reached G4–G5 levels (as shown in the bar graph, source: GFZ), triggered by multiple Earth-directed coronal mass ejections (CMEs). The storm produced intense ionospheric gradients and plasma disturbances across mid and highlatitude regions. Seven IGS stations (provided in the table) across SBAS service regions—ROAG (Spain), HOFN (Iceland), NIST (USA), INEG (Mexico), BHPL (India), STK2 (Japan), and YONS (South Korea)—served as representative monitoring points.
4. SBAS Performance Results: Detailed Interpretation
This section interprets HPL, VPL, and GIVEI behaviors for each SBAS during the storm compared to nominal conditions.
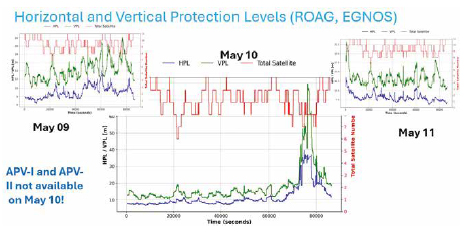
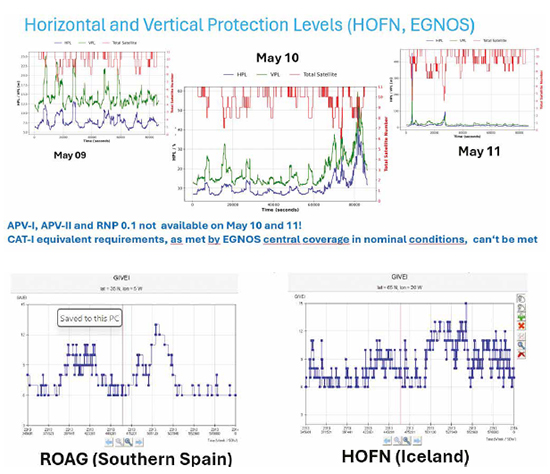
4.1 EGNOS: ROAG (Spain) & HOFN (Iceland)
ROAG showed strong VPL inflation on May 10, exceeding APVI/II thresholds. HPL rose moderately. As an edge-of-coverage location, ROAG is sensitive to ionospheric gradients. HOFN exhibited severe degradation across 10–11 May, including GIVEI = 15 events indicating unmonitored conditions. High latitude auroral activity directly contributed to integrity loss
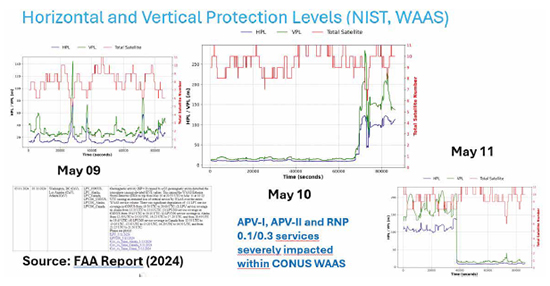
4.2 WAAS: NIST (USA) & INEG (Mexico)
NIST experienced VPL spikes due to reduced WAAS broadcast support for ionospheric grid points. INEG, near the southern WAAS boundary and equatorial anomaly region, saw stronger degradation and prolonged APV unavailability. Edge effects and equatorial plasma bubble activity significantly impacted performance.
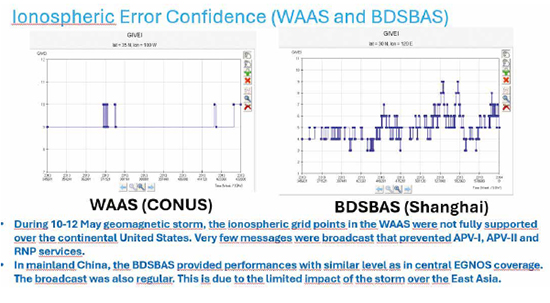
4.3 BDSBAS (Shanghai Region)
BDSBAS demonstrated stable HPL/VPL values and low GIVEI even during storm peaks. The storm’s weaker impact over East Asia and BDSBAS’s dense monitoring network contributed to its strong robustness, the highest among all SBAS examined.
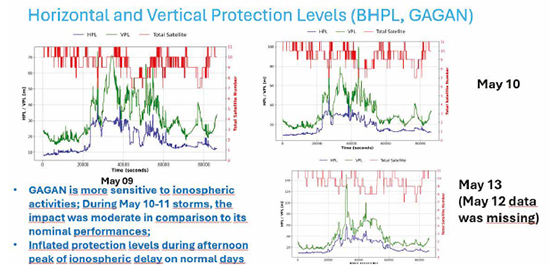
4.4 GAGAN (India)
GAGAN showed moderate storm-related degradation. Even nominal days displayed afternoon VPL rise due to equatorial ionization anomaly (EIA) behavior. This region is inherently variable, and storm activity amplified natural f luctuations but did not trigger unmonitored conditions in this specific storm day.
4.5 MSAS (Japan) & KASS (South Korea)
MSAS experienced significant degradation on May 11 as the storm footprint advanced over East Asia. GIVEI rose sharply, reflecting increased uncertainty. KASS showed milder degradation due to less geomagnetic sensitivity and a more modern monitoring architecture.
5. GIVEI Analysis
Across all SBAS systems, GIVEI increased during storm peaks, driving VPL/HPL inflation. GIVEI = 15 occurred in Iceland, forcing EGNOS to classify the ionosphere as unmonitored. Systems with dense monitoring networks, such as WAAS CONUS and BDSBAS, maintained better stability.
6. Discussion
Edge-of-coverage SBAS regions (ROAG, HOFN, INEG) experienced the strongest degradation. GIVEI behavior directly explained VPL/HPL spikes: as uncertainty increased, integrity bounds inflated. System resilience strongly correlated with ionospheric model density and geographic sensitivity.
System-to-System Comparison
BDSBAS: Highest resilience. EGNOS (central): Moderate resilience. WAAS (CONUS): Moderate, impacted by limited iono message broadcasts. GAGAN: Moderate degradation, affected by equatorial anomalies even on nominal days. MSAS: Strong degradation on May 11. KASS: Moderate degradation, more stable than MSAS on nominal days.
7. Conclusions
All SBAS systems experienced significant performance degradation during the May 2024 storm, especially for approach-level services. BDSBAS proved to be the most resilient. VPL/HPL inflation was driven primarily by rising ionospheric uncertainty (GIVEI). Current SBAS threat models become strongly conservative during disturbed conditions due to lack of biasvariance separation.
Future improvements should focus on enhanced ionospheric threat models, separation of bias and variance components, higher density monitoring networks (particularly at coverage edges), deployment of DFMC SBAS, and integration of real-time space weather analytics.
All these topics will be covered on a regular basis from next month’s consolidated and extended GNSS performance analysis. SouthPAN (Australian SBAS) performance will also be included.
Data sources and Tools:
https://cddis.nasa.gov (Daily BRDC, RINEX OBS); http://ftp. aiub.unibe.ch/CODE_MGEX/CODE/ (Precise Products); BKG “SSRC00BKG” stream; IERS C04 ERP files SBAS Mentor, ESA gLAB GNSS, https://gage.upc.edu/en/learning-materials/ software-tools/glab-tool-suite serenad-public.cnes.fr (SBAS data)


 (2 votes, average: 3.00 out of 5)


Leave your response!