| GNSS | |
Water vapour estimation at few GPS sites in Indian subcontinent
|
|||||||||||||||
| Atmospheric water vapour estimation from the GPS data, surface total pressure and the mean tropospheric temperature is the most cost effective method which gives all weather good spatio-temporal coverage. Precipitable Water Vapor (PWV) in the atmosphere can be estimated from GPS data by determining the travel time delay of GPS radio signals through the troposphere. Water vapour is already identified as an important scientific input needed at various sites for atmospheric and space related studies: improving short term cloud and precipitation forecasts, sharpening images of mesospheric and stratospheric phenomena, to name a few. Its systematic estimation at and around GPS sites would, in turn, considerably enhance the vertical precision of site coordinates, thereby making it a valuable tool in monitoring and modelling of the vertical deformation of environmentally stressed sites.
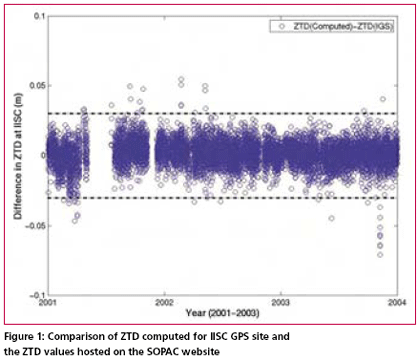
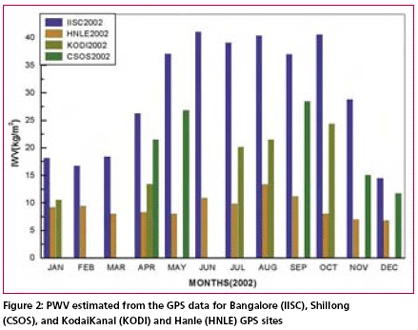
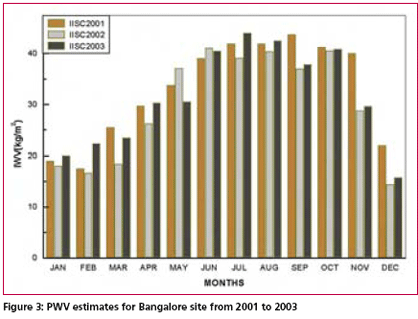
Radio signals transmitted by GPS satellites are refracted by the earth’s atmosphere and the ionosphere, thereby resulting in their delayed arrival at a receiving station, relative to their vacuum path. The delay caused by the ionosphere depends on the total electron content along the path and the signal frequency. Signals monitored at two frequencies using dual frequency GPS receivers, therefore, provide a tractable means of estimating the time delay contributed by the ionosphere, and this quantity can be subsequently used to estimate the distribution of TEC (Total Electronic Content) in the regional ionosphere. The troposphere, on the other hand, is non-dispersive.The path delay caused by it is not dependent on frequency but on the constituents of the atmosphere that are a mixture of dry gases and water vapour. The signal delays introduced by these components, when vertically scaled, represent the Zenith Total Delay (ZTD). The Signal delay (Bevis et al., 1992) is measured by a GPS receiver from all satellites in view, when mapped to the vertical using the cosec function (elevation angle of the satellite) and added, yield the zenith total delay (ZTD). Saastamoinen (1972) showed that the ZTD can be expressed as the sum of Zenith Hydrostatic Delay (ZHD) and Zenith Wet Delay (ZWD). At sea level, ZTD has a magnitude of ~230 cm, of which, the hydrostatic and wet components contribute about ~90% and ~10% respectively, corresponding approximately to the ratio of the total mass of dry air to water vapor in the atmosphere (Cucurull et al., 2002). PWV from GPS dataZTD at a GPS site is estimated from analysis of the GPS data generated at the site along with those at a network of widely spaced IGS (International GPS service) monitoring sites. After accounting for all the errors due to ionospheric refraction, orbital accuracy, antenna phase center modeling, signal mutli-path and scattering by the neighbourhood environment of the receiver, the residual quantity is modelled as being the contribution of the neutral atmosphere. The ZHD is modelled from the surface pressure data at the site, applying a mapping function. ZWD is then obtained by subtracting ZHD from ZTD. The Zenith wet delay thus obtained, is related to the PWV directly above the GPS antenna through a factor proportional to the mean temperature of the atmosphere (Sridevi Jade et al., 2005). C-MMACS scientists, in collaboration with scientists of the various academic host Institutions have established 14 permanent GPS stations in different parts of the country: Bangalore, Kodaikanal, Bhopal, Almora (UP), Leh and Hanle in Ladakh, and eight others in northeastern India. These stations form part of the national network of GPS stations sponsored by the Department of Science and Technology for earthquake hazard assessment studies. All these stations are slated to be equipped with meteorological packages within the next one year so that water vapour estimations at these sites can be routinely made for research and development of potentially operational frameworks for real-time assimilation in meteorological data for numerical weather prediction. At present, contemporaneous meteorological data for such estimations are available only at four sites: Bangalore (13.02° N, 77.57º E), Kodaikanal (10.23° N, 77.47º E), Hanle (32.78° N, 78.97º E), and Shillong (25.57° N, 91.86º E). Accordingly, available daily mean data at these sites for the years 2001, 2002 and 2003, have been used to study the variability of water vapour across a wide region from the temperate Bangalore ( MSL ht 929.32m) to the high altitude desert site at Hanle (MSL ht 4324.41m). Data analysisZenith Total atmospheric delay at the above sites was obtained from the analysis of GPS data using GAMIT/ GLOBK 10.05 data processing software along with the IGS (International GPS Service) sites. These have been compared (Figure 1) with the Zenith total delay at the IGS sites hosted on the SOPAC/CSRC archive (http:// garner.ucsd.edu/pub/troposphere/) and the difference between the expected and observed values fall within the band of ± 0.03m. The Zenith Total atmospheric delay obtained from these analyses for the four GPS sites were used to derive the Zenith wet delay and Precipitable Water vapour (PW) in mm and IWV in kg/m2 using the surface temperature and pressure values to constrain the atmospheric model. The ratio of derived values of PW/ZWD is found to be 0.165 at Bangalore, 0.163 at Shillong, 0.140 at Hanle and 0.157 for Kodaikanal which compare well with the value of 0.15 ± 20% given by Bevis et al. (1994). GPS derived IWV values presented here, are the first such determination over the Indian subcontinent. GPS derived integrated water vapour estimation at four GPS sites geographically spread across the Indian subcontinent (Figures 2 to 4) show the variability of water vapour across the sites with Bangalore having the highest value, Hanle the lowest, Shillong and Kodaikanal having intermediate values, each corresponding well with its geographical location. The Inter- annual variability of IWV (Figure 3 and 4) over the 3 years roughly corresponds to the Indian monsoon intensity with 2002 being the lean one. Water vapour variations (Figure 4) over the year for all the 3 years roughly correspond to the Indian monsoon period with December to March being the dry season and June to October the peak monsoon period, and the intervening months marking a transitional period. IWV estimated from GPS data (Figure 4) is virtually inphase with the ground humidity values. FutureWhilst these results are still far from providing the vertical profile of water vapour in the atmosphere, that needs further developments and modelling to make water vapour tomography possible, currently available approaches as demonstrated above can yield accurate and reliable estimates of vertically integrated IWV above a GPS antenna site using, all weather, inexpensive GPS receivers capable of being deployed widely. 4-dimensional assimilation of IWV estimates when available from widely spread GPS stations, into a meso-scale model, have the potential of greatly offsetting the uncertainties of meteorological forecasts by creating continually updated initial state models. This, however, necessitates real time or near real-time availability of IWV estimates which, in turn, require installation of meteorological sensors at all the GPS sites to measure the surface pressure and temperature to desirable accuracy. With consistent data analysis in terms of methods and models, ground-based GPS will, as the length of the time series grows, become an independent data source in climate monitoring. Meanwhile, simulation experiments designed to assess the quality improvement of forecasts when GPS derived IWV data are incorporated, may generate insightful ideas as to how best may one fruitfully exploit the potential possibilities. AcknowledgementsWe acknowledge the scientific support from Drs S K Srivastav, S K Subramanian and SC Sahu of IMD. We would also like to acknowledge the help rendered by Dr Tushar Prabhu, BC Bhatt and Dr SS Gupta of Indian Institute of Astrophysics. ReferencesBevis, M., Businger, S., Herring, T.A., Rocken, C., Anthes, R.A., Ware, R.H., 1992. GPS Meteorology: remote sensing of atmospheric water vapor using the global positioning system. Journal of Geophysical Research, 97(D14), 15787-15801. Bevis M., Businger, S., Chiswell, S., 1994. GPS meteorology: mapping zenith wet delays on to precipitable water. Journal of Applied Meteorology, 33, 379-386. Cucurull, L., Sedo, P., Behrend, D., Cardellah, E., and Rius, A., 2002. Integrating NWP products into the analysis of GPS observables. Physics and Chemistry of the Earth, 27, 377-383. Saastamoinen, J., 1972. Atmospheric correction for the troposphere and stratosphere in radio ranging of satellites. In: Henriksen, S.W., et al. (Ed.), Geophysical Monograph Series, vol.15, American Geophysical Union, pp.245-251. Sridevi, J., Vijayan, M.S.M., Gaur, V.K., Prabhu, T.P., Sahu, S.C., 2005. Estimates of Precipitable Water Vapour from GPS data over the Indian subcontinent. Journal of Atmospheric and Solar- Terrestrial Physics, 67, 623-635. |
|||||||||||||||
|
|||||||||||||||
|


 (No Ratings Yet)


