| Mapping | |
Terrestrial LiDAR capabilities for cadastral modelling
The paper presents a comparison of terrestrial LiDAR and Distancemeter for surveying 3D spatial data of property units (indoor and outdoor) and producing cadastral representations (2D and 3D). |
 |
|
 |
|
3D cadastre models are recognized as valuable solutions to provide enriched spatial representation for overlapping properties, above-ground and subsurface infrastructures, mining rights, etc. (Paulsson and Paasch, 2013;Pouliot et al., 2011; Stoter et al., 2013).
Cadastral plans and 3D models provide help to a variety of users and tasks depending on the country (van Oosterom et al., 2011). Mainly, they are used to support property identification and registration, and to provide spatial foundations for the security of real estate transactions. One prerequisite for producing 3D cadastral models is having access to 3D spatial data (indoor and outdoor) of the property unit (Jazayeri et al., 2014). For cadastral purposes related to apartments with coownership units, the third dimension of spatial data may be expressed as vertical elevation (orthometric or ellipsoidal altitude) or Z coordinates of the boundary unit, height of the building level, or volume of the legal 3D units.
Various land survey instruments are currently used to acquire such 3D spatial data, including GNSS/GPS, total station, stereo-photography, Distancemeter (laser rangefinder), and terrestrial LiDAR (laser scanner). A recent questionnaire sent to members of the professional association of land surveyors in the province of Quebec, reveals that the field instruments currently used to survey vertical data for apartments with co-ownership units are Distancemeter, ribbon, total station and GPS. Photogrammetry and terrestrial LiDAR are less popular instruments. When the same land surveyors were asked what they anticipated practices in 10 years to be, LiDAR is foreseen as the instrument having the highest progression (from 8% to 47%) to survey vertical cadastral information of apartments with co-ownership units.
Based on this input, the issue of identifying the capabilities of terrestrial LiDAR instruments to survey 3D lots for apartments with co-ownership units appears important and relevant. Terrestrial LiDAR is used for a wide variety of applications such as city modelling, robotics, archaeology, agriculture, or in the mining industry, (Shan and Toth 2008). However, as far as we know, no specifications and few experiments exist for acquiring LiDAR data adapted to cadastral modeling of indoor and outdoor property units (Jamali et al., 2013; Hao, 2011; Souza and Amorim, 2012).
This new field of application of the LiDAR instrument is a motivating factor; it may represent a lucrative market for land surveyors and resellers. Is the LiDAR requirement the same for cadastral application and city building modelling? This study will try to answer this question by examining the capabilities in comparison to traditional survey instrument with terrestrial LiDAR, for acquiring 3D spatial data required for the production of cadastral representation (2D plans and 3D models).
Study cases and methodology
The methodology consisted of using a terrestrial LiDAR (laser scanner) to survey two apartment buildings (co-ownership units), and comparing its capabilities with current survey instruments to produce 2D cadastral plans and 3D models. The features of interest are the boundaries of the 3D units, which are not visible (fiat objects) and consequently deduced from human opinion, and the presence of physical objects (bona fide); in the case of an apartment such physical objects may correspond to walls, ceilings, floors, stairs, etc.
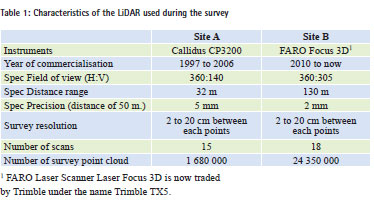
The case studies are located in the province of Quebec, Canada, and correspond to a simple apartment structure composed of two levels with two co-owners (private and common parts). Table 1 shows some technical information for the LiDAR used. For the traditional survey, both sites were measured with a Distancemeter instrument (a portable laser rangefinder with a precision of 5 mm for a distance of 50 m). Callidus and Faro LiDAR instruments were selected mainly because they were available in our laboratory.
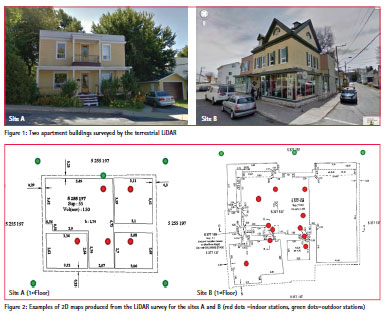
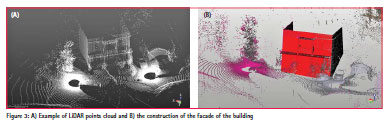
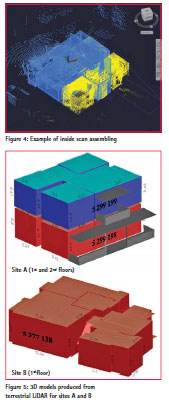
The focus of the study is not to compare one LiDAR technology to another, but the fitness for use of LiDAR acquisition approach (scanning instruments) compared to traditional survey instrument. Figure 1 presents a picture of the two apartment buildings. Both sites refer to two co-owners and present two floors. Both sites were surveyed by Distancemeter and LiDAR instruments. Figure 2 shows for each site the 2D plans produced from LiDAR data (plans of site B were built by Groupe VSRB, http://www.groupevrsb. com/, a private firm collaborating with us). For site A, 10 indoor stations and 5 outdoor stations were scanned by the LiDAR, while for site B, 15 indoor stations and 3 outdoor stations were required. Objects to be scanned were walls, ceilings and floors. In total, site A needed 16 walls to be recorded while site B required 49 walls. To this, we collected and recorded the height of the ceilings and the altitude of the floors. Figure 3a shows an example of the points cloud for site A, while figure 3b presents the preliminary construction of the facade. Figure 4 shows an example of inside scan assembling. Finally, figure 5 presents the 3D models produced from the LiDAR points (Trimble RealWorks for scan assembling and Autocad for map designing were used).
Comparison
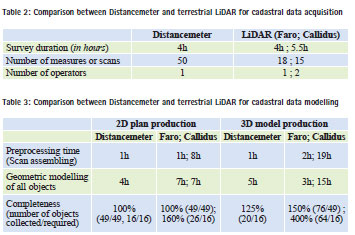
To enable the comparison, a list of criteria was first established – some are related to the acquisition phase and others to the modelling steps. This list was verified with the land surveyor firm. The 2D plans and 3D cadastral models were produced from traditional spatial data collected by laser rangefinder (Distancemeter) and laser point cloud (LiDAR). Regular cartographic production and 3D modelling techniques and software were used. The 2D cadastral plans created from the Distancemeter were produced by a land surveyor firm (Groupe VRSB), and they respect the specifications of the Quebec Department of natural resources that is responsible for maintenance of the cadastral system. The graphic tolerance for the plans is 21 cm at a scale of 1,000. The rest including the 3D models were produced by the authors, respecting the same specifications. Tables 2 and 3 present a subset of the results of the comparison made.
Discussion and conclusion
Some facts may be outlined from the comparison between the Distancemeter and LiDAR survey instruments. The survey duration of LiDAR instrument is slightly longer than Distancemeter. This result is dependent on scan speed, number of scans and the view angle per scan. The number of operators is also important to consider. For the Distancemeter, only one operator was required, while for the Callidus, two operators were necessary and one operator for the Faro. Data acquisition strategy may also be setup for LiDAR technology in order to reduce the survey duration and cost. For instance, not scanning the entire space but only specific objects related to the boundary of the 3D units was perceived as a valuable approach, but not experimented in the current tests. Overall, the acquisition phase is quite comparable between both instruments. Nevertheless, both instruments use distinctive mode of data acquisition. The LiDAR systems scan everything in the space while with the Distancemeter, the operator has to decide what objects are to be surveyed. For example, if the operator forgets to survey some objects, another survey will be required. This condition directly impacts the planning strategy for acquisition and modeling phases.
Regarding the modelling phase, the results show mixed conclusions. The production of 2D plans by Distancemeter clearly presents better results compared to LiDAR technology while, it performs better for the production of 3D models compared to 2D plans. The main issue for LiDAR data processing is to determine the geometry of the object extracted from the numerous point clouds, while with Distancemeter, the geometry of the object is already known in the field (by the operator). This situation is easily explained by the distinctive mode of data acquisition of each instrument. The production of the 3D models took a longer time with the Distancemeter than with Faro data, but was faster compared to Callidus data. This situation is explained by the fact that no targets were used on site for the Callidus survey. Scan assembling and modelling of the objects were thus, more complex and time consuming when keeping the same production specifications. If we compare the completeness of the 3D models, it appears that the number of objects in the final product is higher for the point cloud compared to Distancemeter. Obviously, this situation is explained by the mode of data acquisition of LiDAR technology that collects all objects in the field of view, no matter if they are of interest. This aspect may be foreseen as an advantage of using LiDAR technology, specially when multi-usage of the 3D spatial data are planned (e.g., for urban planning or architectural projects).
Regarding the cost, they are estimated based on an operator’s average salary, the survey or modeling duration and the instruments’ rental fees (30$/day Distancemeter and 600$/day Faro). The training period was not considered (but could be part of this estimation). For the acquisition phase, we estimated the cost at 400$CDN for the Distancemeter and 1000$CDN for the Faro. For the modeling phase, 600$CDN was appraised for the Distancemeter and 800$ CDN for the Faro. Overall, not surprisingly, the cost for using Distancemeter was lower compared to LiDAR. Nevertheless, the difference is not considerable and yet should not be the only criteria to take into consideration when such needs arise.
Based on our experiment, it is currently difficult to draw conclusions about the distinctiveness of these results between surveying and modelling cadastral data compared to other kinds of objects, like city buildings. It is clear that for physical objects like walls and ceilings, the challenges are quite similar (scan resolution, scan assembling, obstruction, object reflectance, etc). Determination of the boundary of the 3D units (fiat objects) still remains as the result of the opinion of an expert. For traditional surveying, this opinion is somehow integrated with a field survey, as for LiDAR technology, this opinion may be estimated during data processing. This situation may have an important impact depending on who is doing the survey and the modeling phases. The number of objects to model and the geometric complexity of these objects are certainly some of the main criteria to take into consideration, when determining the advantages of LiDAR technology compared to traditional instruments. For instance, LiDAR point cloud offers the possibility of producing more detailed 3D model (i.e., containing not only cadastral limits).
In conclusion, we can state that LiDAR technology offers interesting performance for surveying apartments and producing cadastral data. However our experiment only proposes preliminary results and has many limitations. For instance, two apartment buildings are not sufficient to generate robust recommendations about better practices for LiDAR data acquisition and modelling. The selected apartment buildings were structurally quite simple (two levels) and did not allow us to fully address the complexity factor (geometric complexity of the object), which is probably a significant and distinctive criterion between both instruments. One of our future hypotheses to test would be: Higher is the geometric complexity of the building, better performance of LiDAR, and study sites will be selected to consider this factor. Overall, recent LiDAR technology like the Faro instrument obviously shows better results compared to older systems like the Callidus. Regarding the surveying of common or private parts (important factor for decision-makers like land tenure lawyers), no attention was paid to this end. We treated them as the same category of object. Further tests may integrate those important elements.
Acknowledgements
We would like to sincerely thank Michel Bédard and Guy Langlois from the Groupe VRSB for providing the study sites, and some datasets of the apartments. We also would thank Cansel Quebec for training and software leasing and S. Daniel, professor at the Geomatic sciences department, for training and hardware leasing. We express our gratitude to the Natural Sciences and Engineering Research Council for funding this research program.
References
Hao, M. 2011, Assessment of Mobile Laser Scanning Data in 3D Cadastre. Master thesis, Faculty of Geo-information Science and Earth Observation of the University of Twente.NL.
Jamali, P., Boguslawski, E. E., Duncan, C., Gold,M., Rahman,A.A., 2013, Rapid indoor data acquisition for LADM-based 3D cadastre model. ISPRS Annals, 8th 3D GeoInfo Conference, Istanbul, Turkey, November 27-29 2013.
Jazayeri I, RajabifardA., Kalantari M., 2014,A geometric and semantic evaluation of 3D data sourcing methods forland and property information. Land Use Policy, 36, pp. 219-230.
Paulsson, J., and Paasch, J. M., 2013, 3D property research from a legal perspective Computers, Environment and Urban Systems, Volume 40, July 2013, pp. 7–13
Pouliot, J., Roy, T., Fouquet-Asselin, G., Desgroseilliers, J., 2011, 3D Cadastre in the province of Quebec: A First experiment for the construction of a volumetric representation. In Advances in 3D Geo-Information Sciences (Series: Lecture Notes in Geoinformation and Cartography), Springer-Verlag, Eds: Kolbe, König and Nagel. Berlin, Nov. 3-4, pp. 149-162.
Shan J. and Toth, C.K., 2008, Topographic Laser Ranging and Scanning: Principles and Processing. CRC Press, 590 pages.
Souza, G. H. B., and Amorim, A. 2012, LiDAR data integration for 3D Cadastre : some experiences from Brazil. FIG Working Week 2012, Rome, Italy, 6-10 May.
Stoter. J., H. Ploeger, P. van Oosterom (2013) 3D cadastre in the Netherlands: Developments and international applicability, Computers, Environment and Urban Systems, Volume 40, July 2013, pp. 56–67 Stoter, J., 2004,
“3D Cadastre.” Netherlands Geodetic Commission (NCG): Publications on Geodesy 57. PhD thesis, Delft University of Technology, the Netherlands.
van Oosterom, P., Stoter, J., Ploeger, H., Thompson, R., Karki, S., 2011, “World-wide Inventory of the Status of 3D Cadastres in 2010 and Expectations for 2014.” in FIG Working Week: Marrakech. May 2011.


 (4 votes, average: 2.50 out of 5)


Leave your response!